Surface Sentry Context While Debugging Your Own Site with the Dev Toolbar

The Dev Toolbar, now in open beta, is a floating widget in your web app, offering meaningful Sentry insights for the specific page being viewed. With three different page-aware panels: Issues, Feedback and Feature Flags, you can quickly surface relevant actionable issues when you have the most context for understanding them: as you browse your own site.
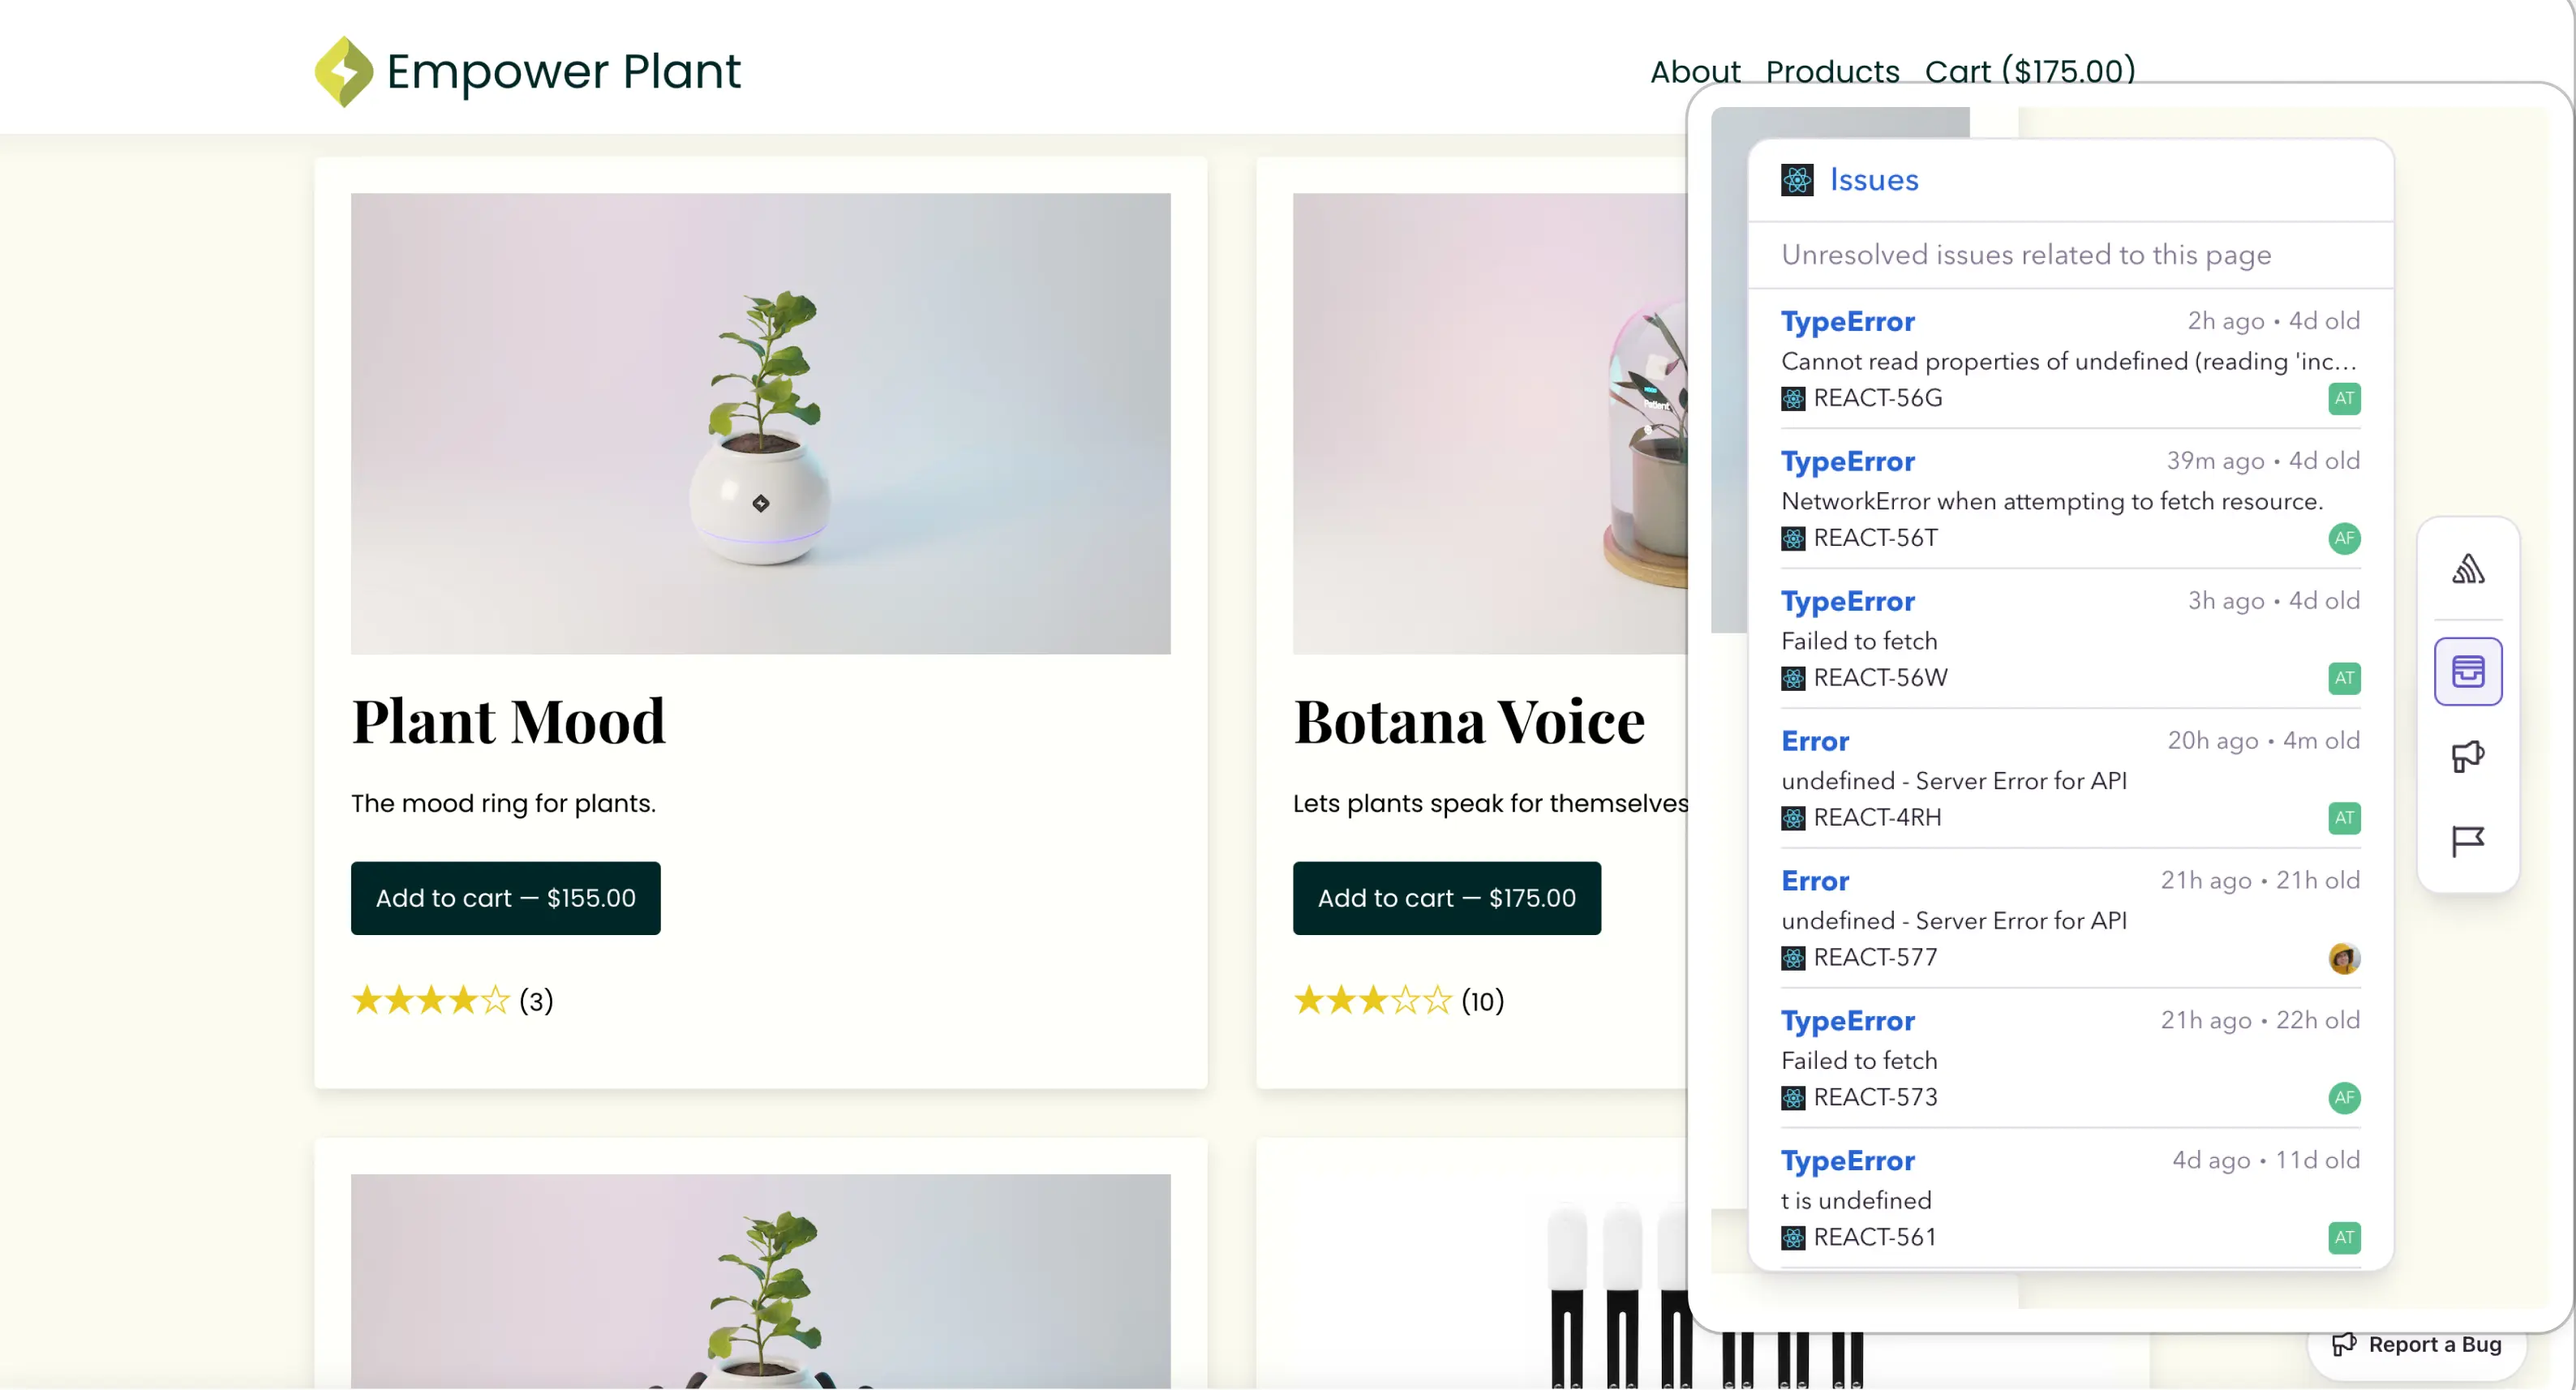
image.png

The Dev Toolbar contains the following panels:

  • Issues: your highest priority frontend issues for the page you are currently viewing.
  • Feedback: shows you the most recent user feedback messages for the page you are on, so you can more easily contextualize user feedback coming from  Sentry’s User Feedback Widget.
  • Feature Flags: quickly view and locally override feature flags that your team has enabled for your web application, so you can verify their behavior and observe the impact they might have on errors.

To learn more about how to add the Dev Toolbar on your website and across any environment (local, staging, and production), see here .

Your code is broken. Let's Fix it.
Get Started