The two new widgets on Sentry’s Profiling page provide quick insights on what to optimize to drive performance improvements:
Slowest Functions: The slowest functions in your application, ranked by total self-time
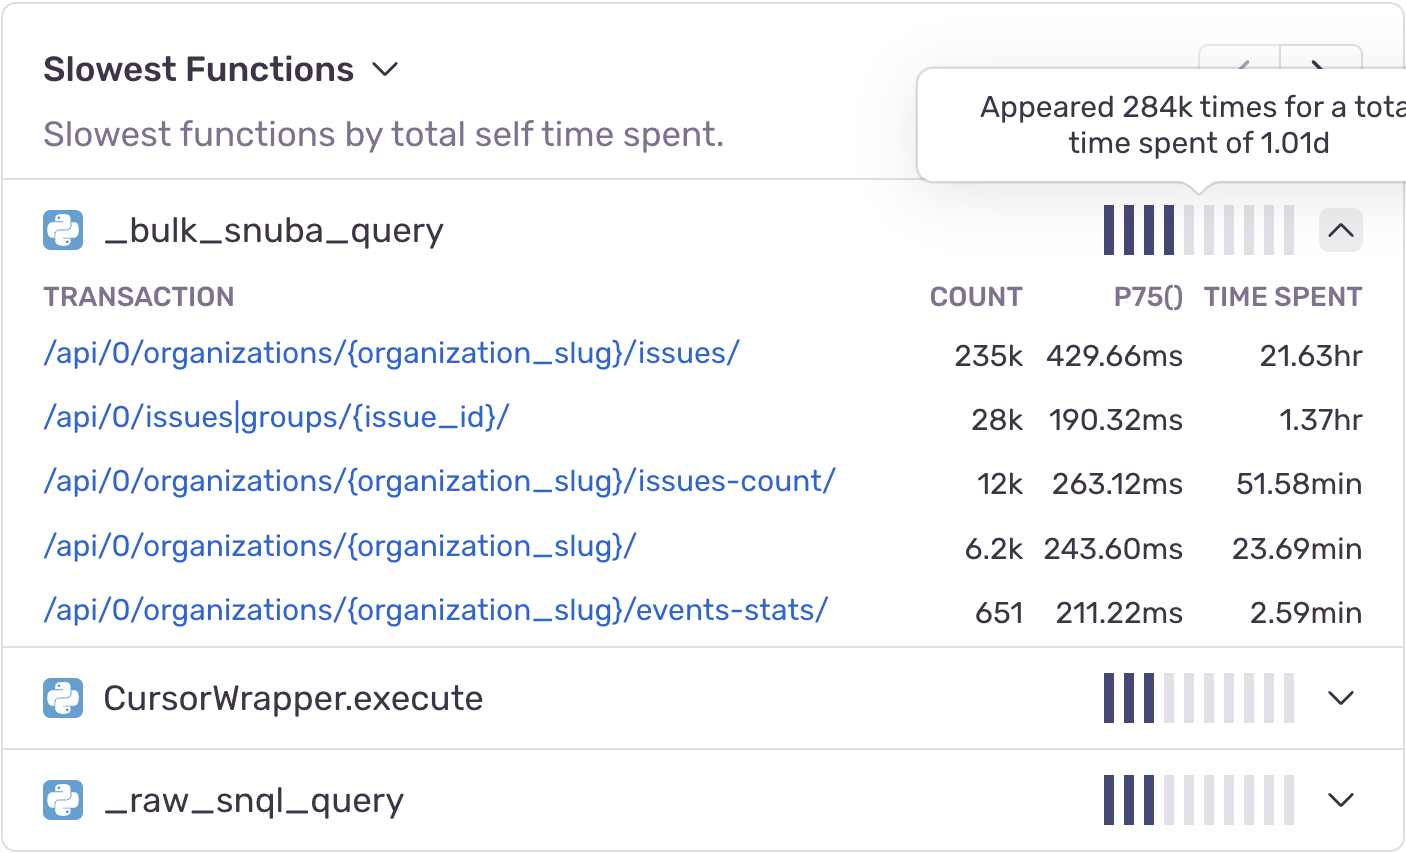
These can be potential starting points when looking for the performance bottlenecks in your application.
Most Regressed Functions: The functions in your code that have regressed most (as measured by self-time) over the selected time period
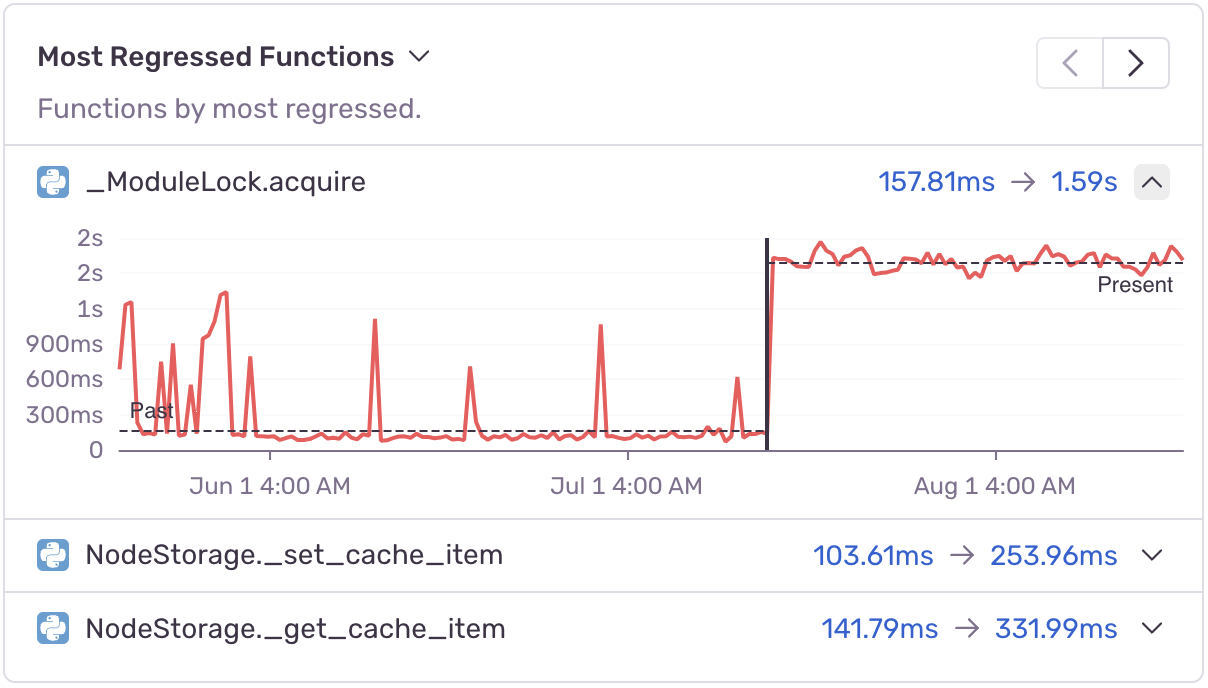
Our breakpoint detection algorithm automatically pinpoints the exact time at which the regression started, such that you can quickly identify and correct the software release that led to the slowdown.
You can deploy Profiling with only a few lines of code. Please see our announcement blog post and setup guide for details.
