As of today, Sentry has introduced the new Queries Insights workflow as the latest addition to our Performance product.
With Query Insights, you can quickly identify and analyze those slow queries consuming the most time in your database. You will find the Queries feature tab just under Performance in the sidebar.
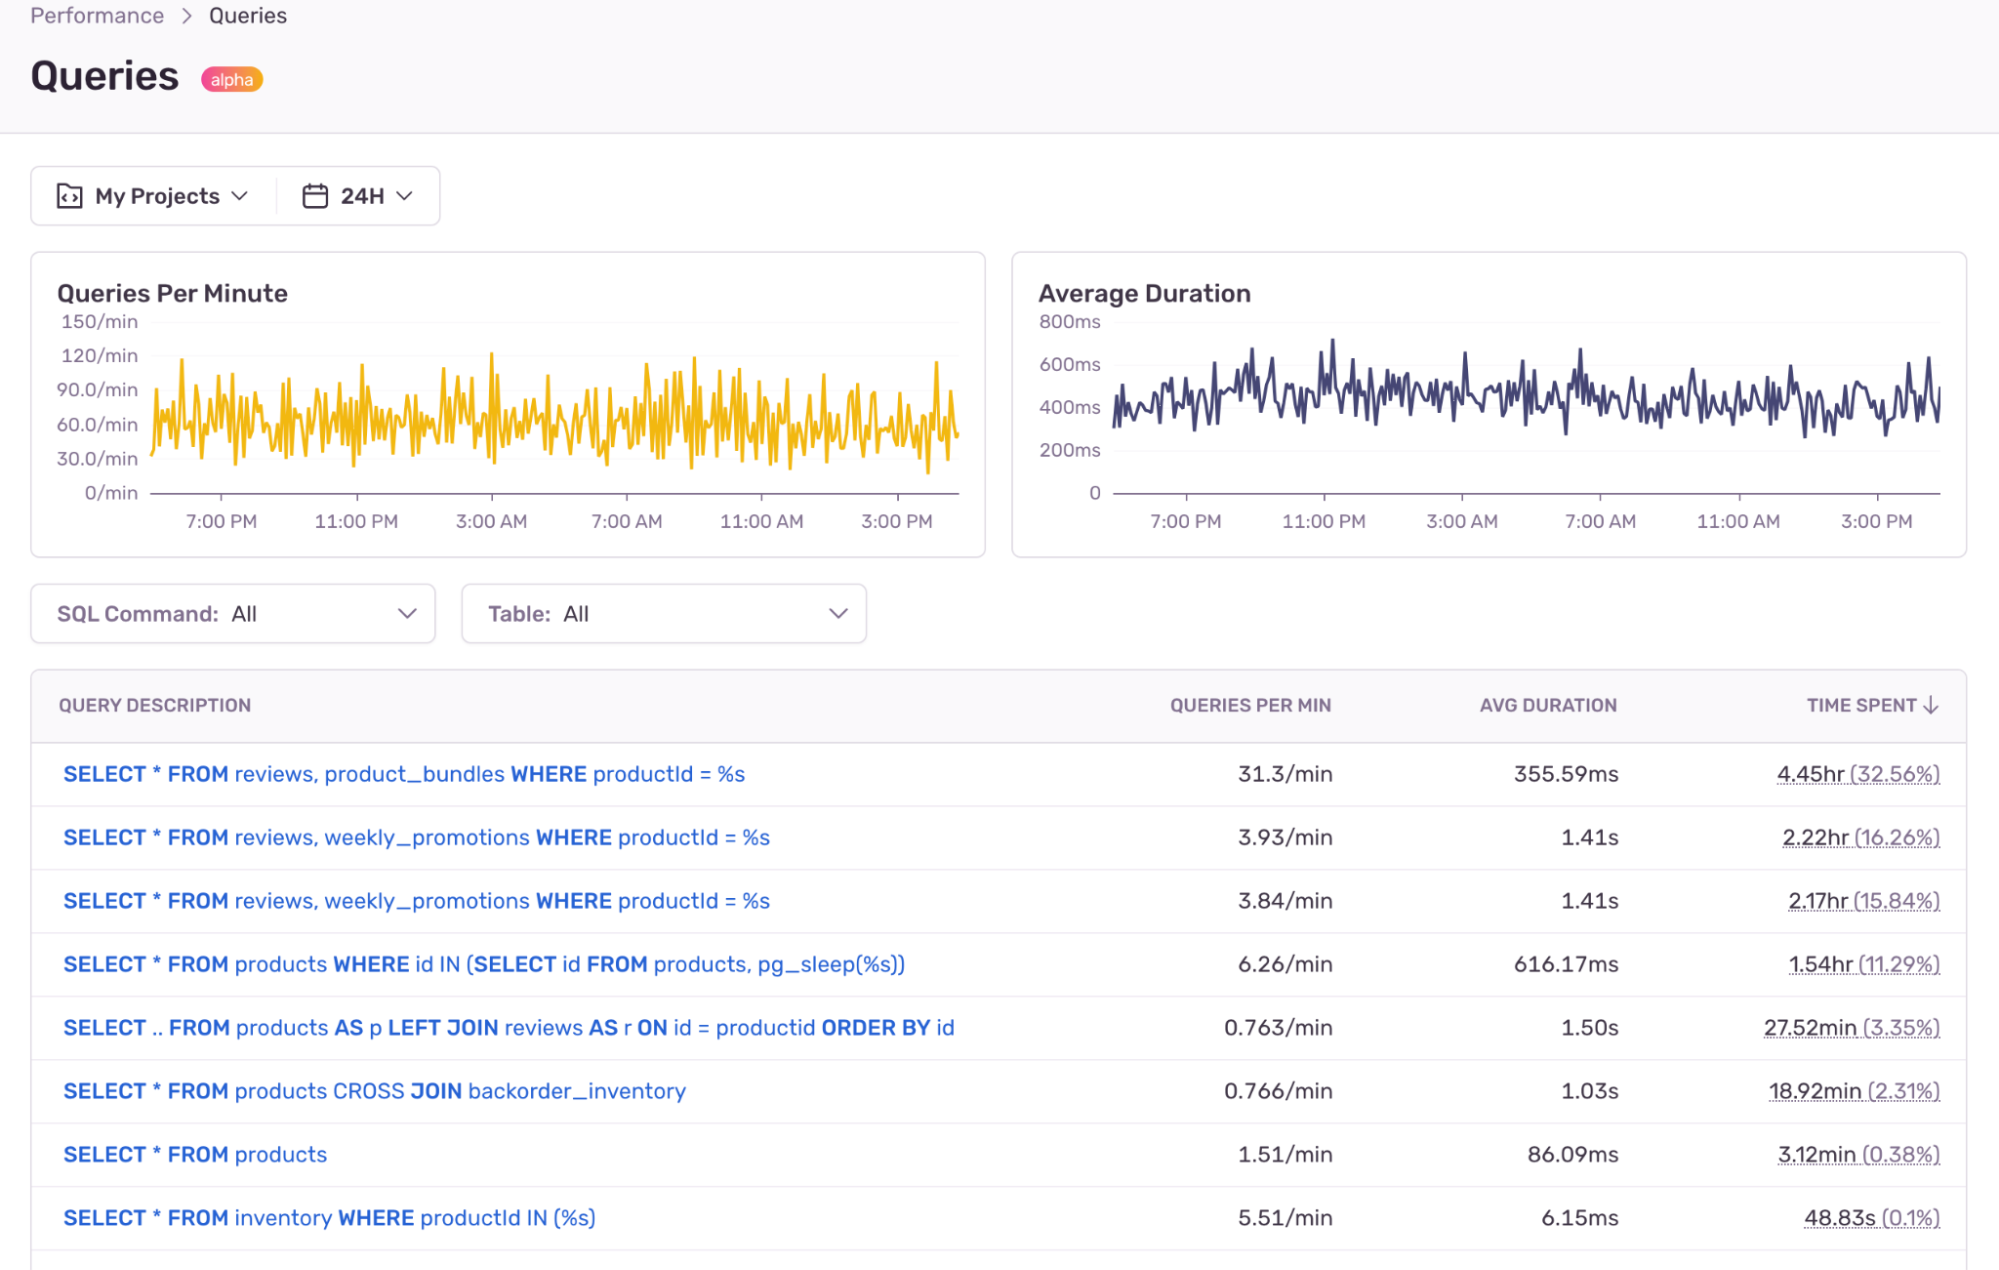
On the Queries landing page, you will find a searchable list of database Queries from your application, ordered by total run time
By clicking into any of these queries, you can zoom into the details for the selected query and investigate sample events to better understand the context for any performance bottlenecks
Please note that to use Query Insights, you will need to set up our Performance product. Please take a look at our setup guide for instructions.
Want to learn more or have questions? Take a look at our blog post and join the discussion on Github.
 Github