
Django Error Monitoring
Actionable insights to resolve Django performance bottlenecks and errors. Improve your monitoring workflow with a full view of releases so you can mark Django errors as resolved and prioritize live issues.
More than 150K Organizations Trust Sentry with Their Application Monitoring
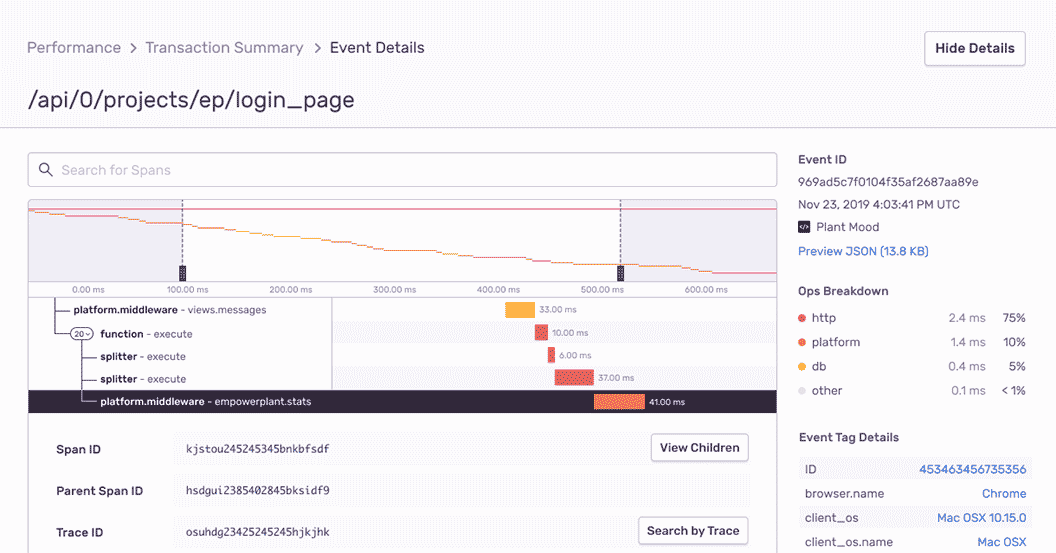
Django Performance Monitoring
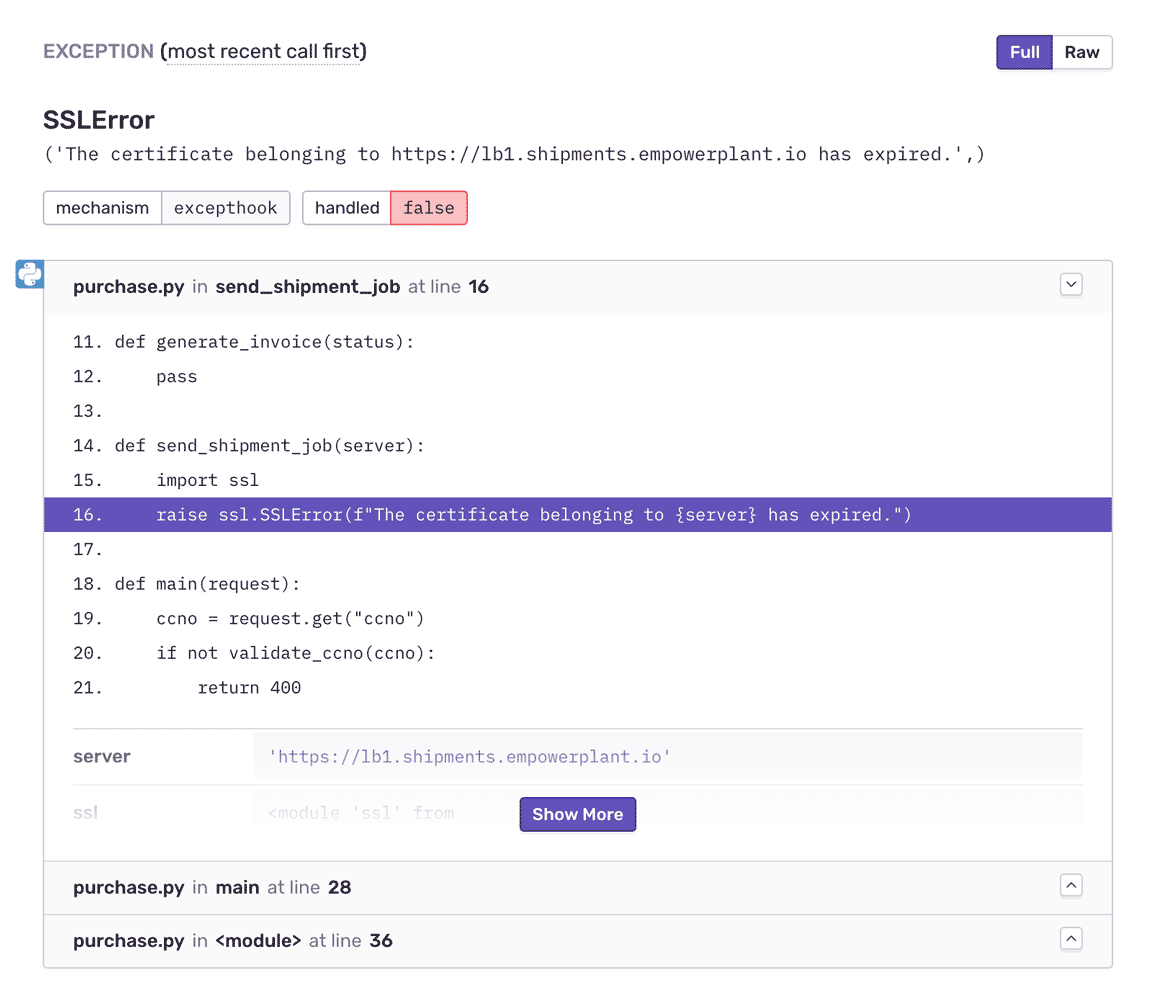
Complete Stack Traces, With Local Variables
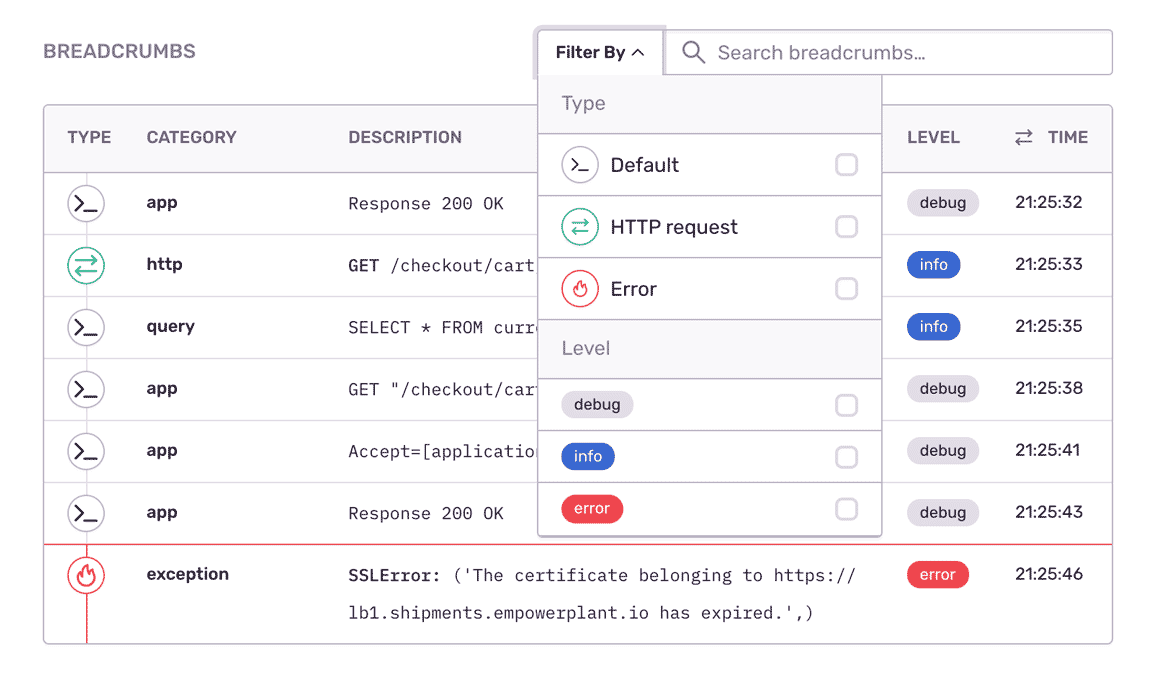
Fill In the Blanks

Your Logs, Next to the Request
Send your Django logging output to Sentry and query it alongside the request trace and the exception. The log lines that surrounded a failed view are attached to it, so you can see the retry, the failed upstream call, or the unexpected state that caused it.
Learn more about Logs in Sentry.
"Sentry helps our team fix the most important issues in each release."
See the Full Picture of Any Exception
Aggregate errors by details like HTTP request, hostname, and app version to see what's new, a priority, or a trend.
Assign custom tags to reproduce the error environment specific to your application, business, and users.
Find answers to key questions: How actionable is this error? In which app release did the Django bug occur?
FAQs
Install the Sentry Python SDK and enable tracing. Sentry then instruments your Django app automatically: the middleware stack, synchronous signal receivers, database queries, cache read operations, and Redis commands all become spans on a distributed trace, so you can see which layer made a request slow.
Add Profiling to get function-level detail on the slowest requests, and Logs to keep your Django logs beside the trace that produced them. Sentry supports Django 1.8 and above.
Yes. The Django integration instruments your database queries automatically and records each one as a span, so slow and repeated queries show up directly on the trace for a request. Cache reads and Redis commands are instrumented the same way.
Because queries are attached to the trace rather than sitting in a separate tool, you can see the request, the query that slowed it down, and any related error together. Learn more about Tracing.
Yes. Sentry Logs lets you send, view, and query structured logs from your application alongside your errors and traces. Because logs sit next to the error and the trace that produced them, you get the granular context — retries, API failures, internal state — that spans and stack traces alone can miss, without switching tools.
Learn more about Logs in Sentry.
Seer is Sentry's AI debugging agent. It reads the full context Sentry already has — the error, its stack trace, the surrounding trace, logs, and profiles — to find the root cause of an issue and propose a fix. Seer can open a pull request with that fix, hand the work to an external coding agent, or review your PRs before they ship.
You can get started for free. Pricing depends on the number of monthly events, transactions, and attachments that you send Sentry. For more details, visit our pricing page.
Sentry doesn't impact a web site's performance.
If you look at the configuration options for when you initialize Sentry in your code, you'll see there's nothing regarding minimizing its impact on your app's performance. This is because our team of SDK engineers already developed Sentry with this in mind.
Sentry is a listener/handler for errors that asynchronously sends out the error/event to Sentry.io. This is non-blocking. The error/event only goes out if this is an error.
Global handlers have almost no impact as well, as they are native APIs provided by the browsers.