
Flutter Error & Performance Monitoring with Sentry
Debug Flutter apps and prevent crashes across your entire stack. Flutter crash reporting and logging with a single view so you can diagnose, fix, and optimize the performance of your code with maximum efficiency.
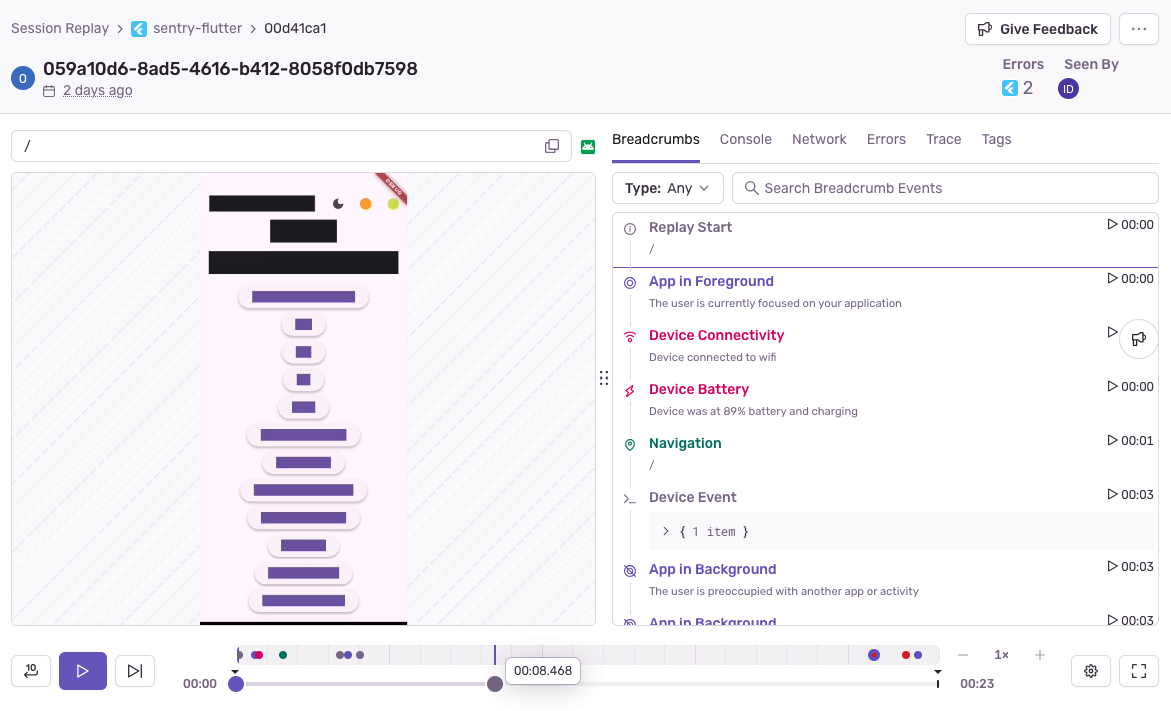
Session Replay
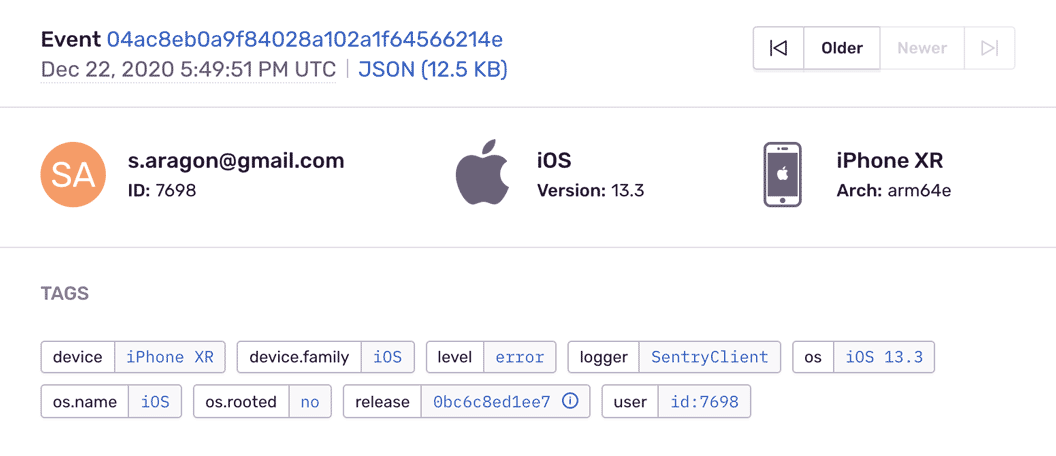
Application Monitoring, End to End
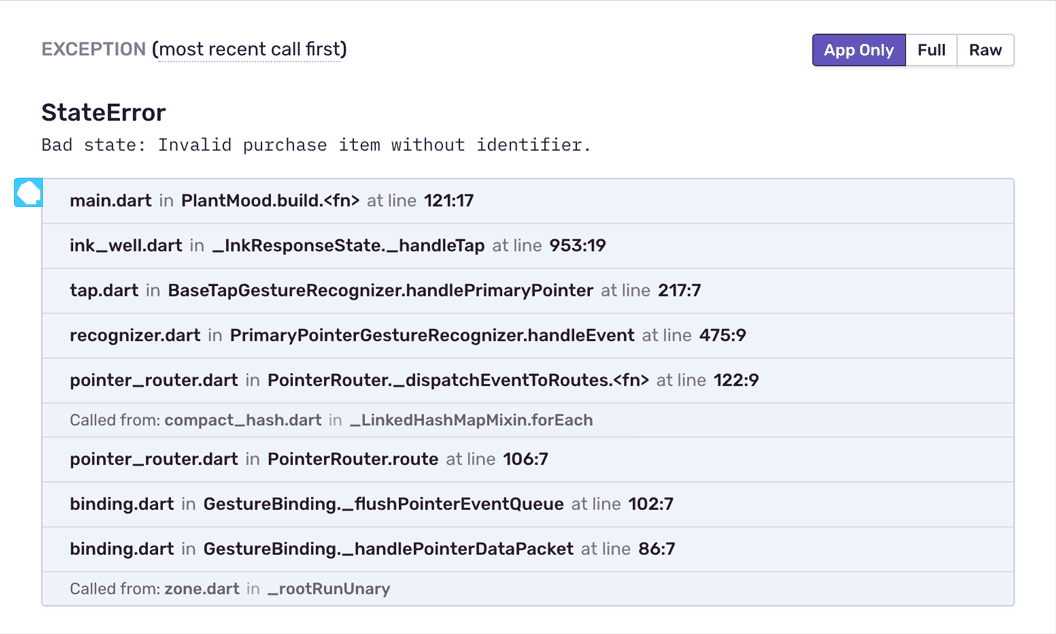
Complete, Symbolicated Stack Traces
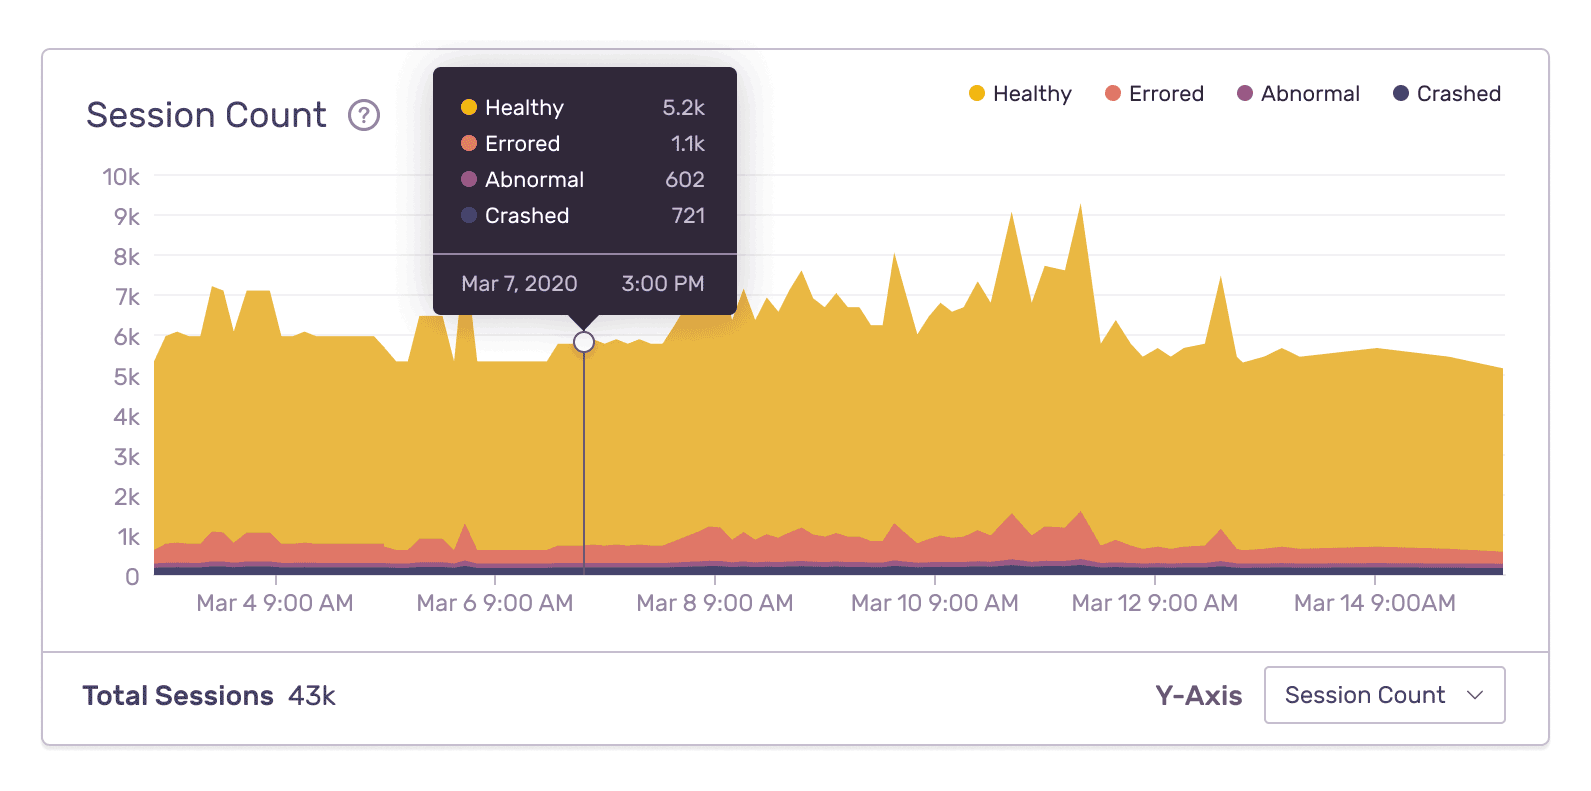
Flutter Crash Reporting

Your Logs, Next to the Crash
Send logs from your Flutter app to Sentry and query them next to the errors and traces they belong to. The log lines leading up to a crash travel with the crash report, so you can see what the app was doing before it failed.
Learn more about Logs in Sentry.
"Flutter provides customers with a fast path to building beautiful apps for multiple platforms from a single codebase. But one big challenge for mobile app developers is dealing with all the dependencies that can affect an application's uptime and performance across multiple platforms. Thanks to Sentry's Flutter support, developers now have access to a great suite of tools for monitoring and maintaining their app."
FAQs
Sentry supports every major language, framework, and library. You can browse each of them here.
You can get started for free. Pricing depends on the number of monthly events, transactions, and attachments that you send Sentry. For more details, visit our pricing page.
Sentry doesn't impact a web site's performance.
If you look at the configuration options for when you initialize Sentry in your code, you'll see there's nothing regarding minimizing its impact on your app's performance. This is because our team of SDK engineers already developed Sentry with this in mind.
Sentry is a listener/handler for errors that asynchronously sends out the error/event to Sentry.io. This is non-blocking. The error/event only goes out if this is an error.
Global handlers have almost no impact as well, as they are native APIs provided by the browsers.
Yes. The Sentry Flutter SDK captures Dart errors and unhandled exceptions as well as native crashes on the iOS and Android layers underneath, so a crash in platform code is reported the same way as one in your Dart code.
Upload your debug symbols so obfuscated release stack traces are readable, and add Session Replay to see what the user did in the moments before the crash.
Yes. Sentry Logs lets you send, view, and query structured logs from your application alongside your errors and traces. Because logs sit next to the error and the trace that produced them, you get the granular context — retries, API failures, internal state — that spans and stack traces alone can miss, without switching tools.
Learn more about Logs in Sentry.
Seer is Sentry's AI debugging agent. It reads the full context Sentry already has — the error, its stack trace, the surrounding trace, logs, and profiles — to find the root cause of an issue and propose a fix. Seer can open a pull request with that fix, hand the work to an external coding agent, or review your PRs before they ship.