
Laravel Error and Performance Monitoring
Actionable insights to resolve Laravel performance bottlenecks and errors. Improve your monitoring workflow with a full view of releases so you can mark Laravel errors as resolved and prioritize live issues.
Getting Started is Simple
Install the sentry/sentry-laravel package with Composer:
composer require sentry/sentry-laravel
Add Sentry reporting to bootstrap/app.php:
<?php

use Illuminate\Foundation\Application;
use Illuminate\Foundation\Configuration\Exceptions;
use Illuminate\Foundation\Configuration\Middleware;
use Sentry\Laravel\Integration;

return Application::configure(basePath: dirname(__DIR__))
    ->withRouting(
        web: __DIR__.'/../routes/web.php',
        commands: __DIR__.'/../routes/console.php',
        health: '/up',
    )
    ->withMiddleware(function (Middleware $middleware) {
        //
    })
    ->withExceptions(function (Exceptions $exceptions) {
        Integration::handles($exceptions);
    })->create();
Enable Sentry Tracing in config/sentry.php:
// Specify a fixed sample rate:
'traces_sample_rate' => 0.2,
// Or provide a custom sampler:
'traces_sampler' => function (SentryTracingSamplingContext $context): float {
    // return a number between 0 and 1
},
Run this Artisan command to configure the Sentry DSN:
php artisan sentry:publish --dsn=<paste-your-DSN-here>
Check our documentation for the latest instructions.
See all platformsMore than 150K Organizations Trust Sentry with Their Application Monitoring
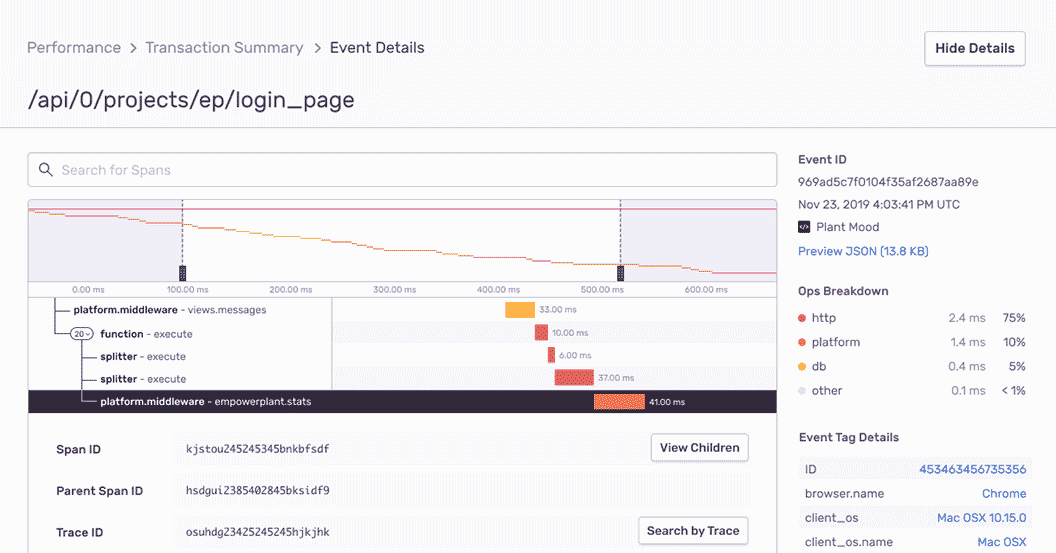
Laravel Performance Monitoring
Quickly identify performance issues and view full end-to-end distributed trace to see the exact, poor-performing API call and surface any related errors.
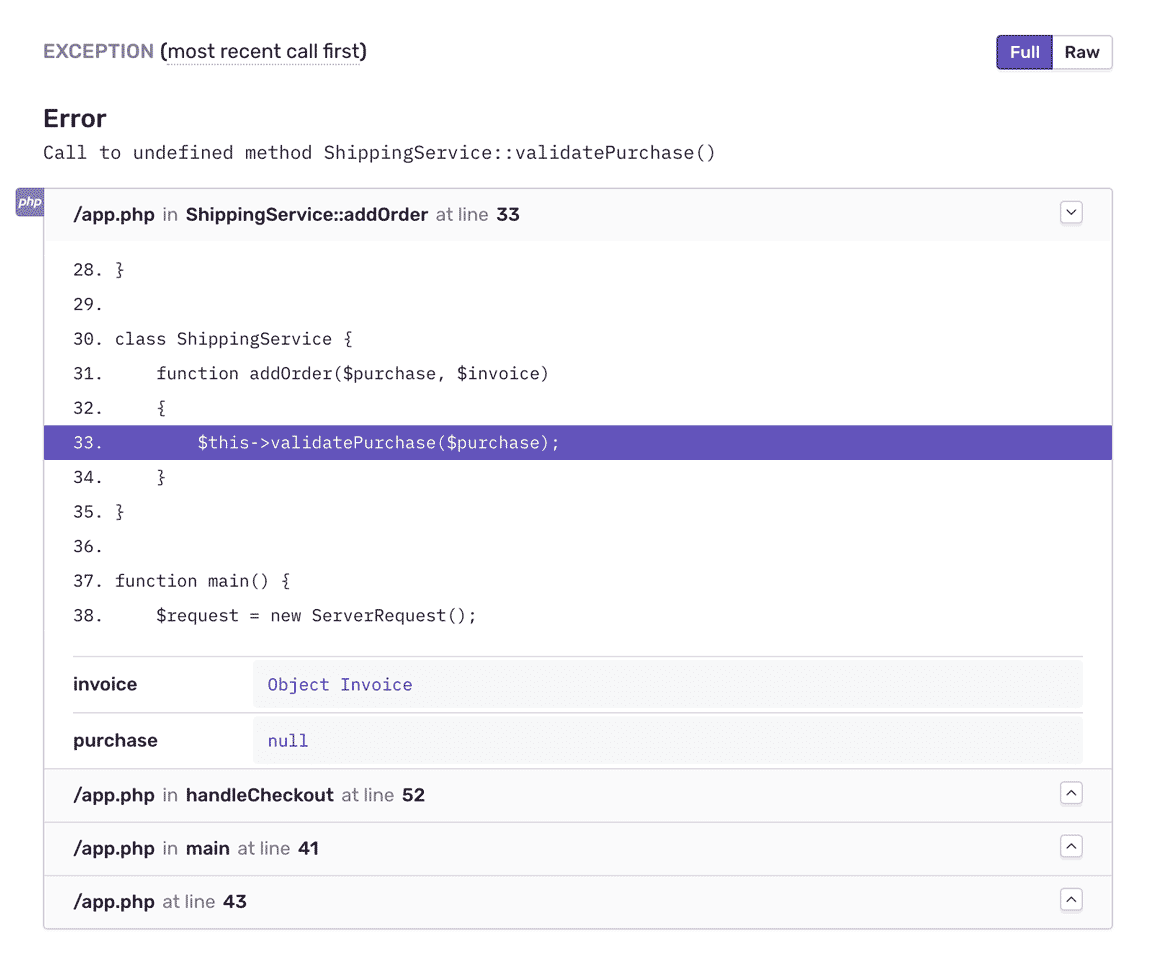
Laravel Error Monitoring with Complete Stack Traces
See local variables in the stack for prod errors, just like in your dev environment. Explore the full source code context with frame to function data. Filter and group Laravel exceptions intuitively to eliminate noise.
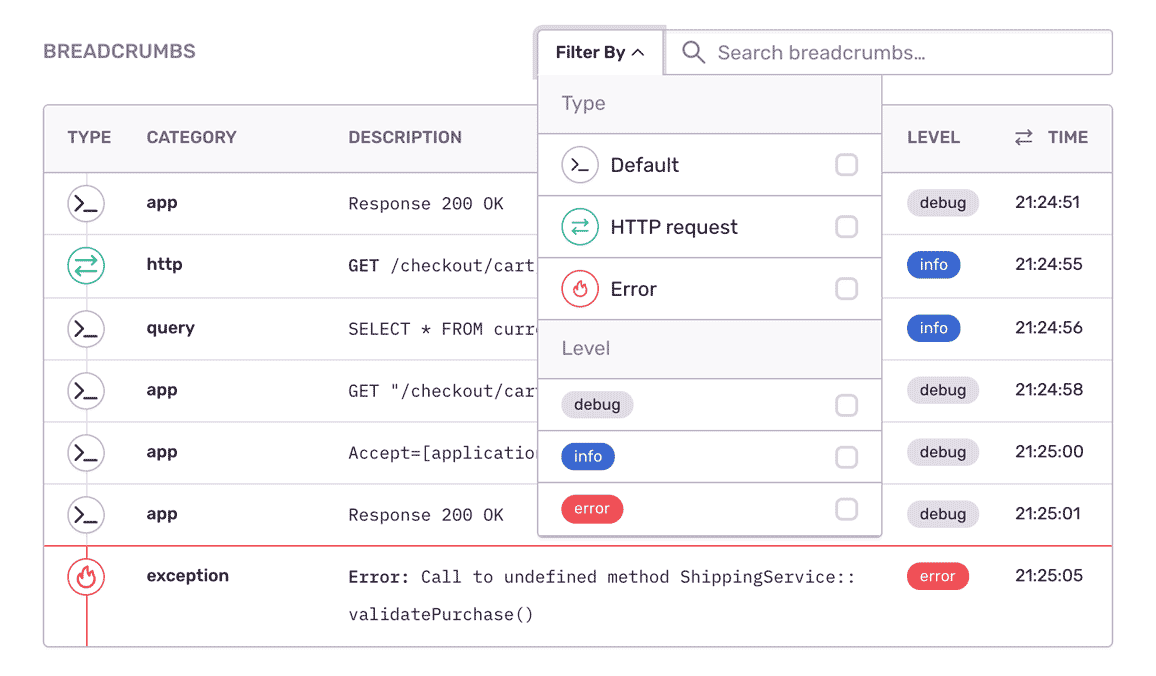
Fill In the Blanks About Laravel Errors
Expose the important events that led to each Laravel exception: network requests, SQL queries, debug logs, post errors. Learn in which version a bug first appeared, merge duplicates, and know if things regress in a future release.
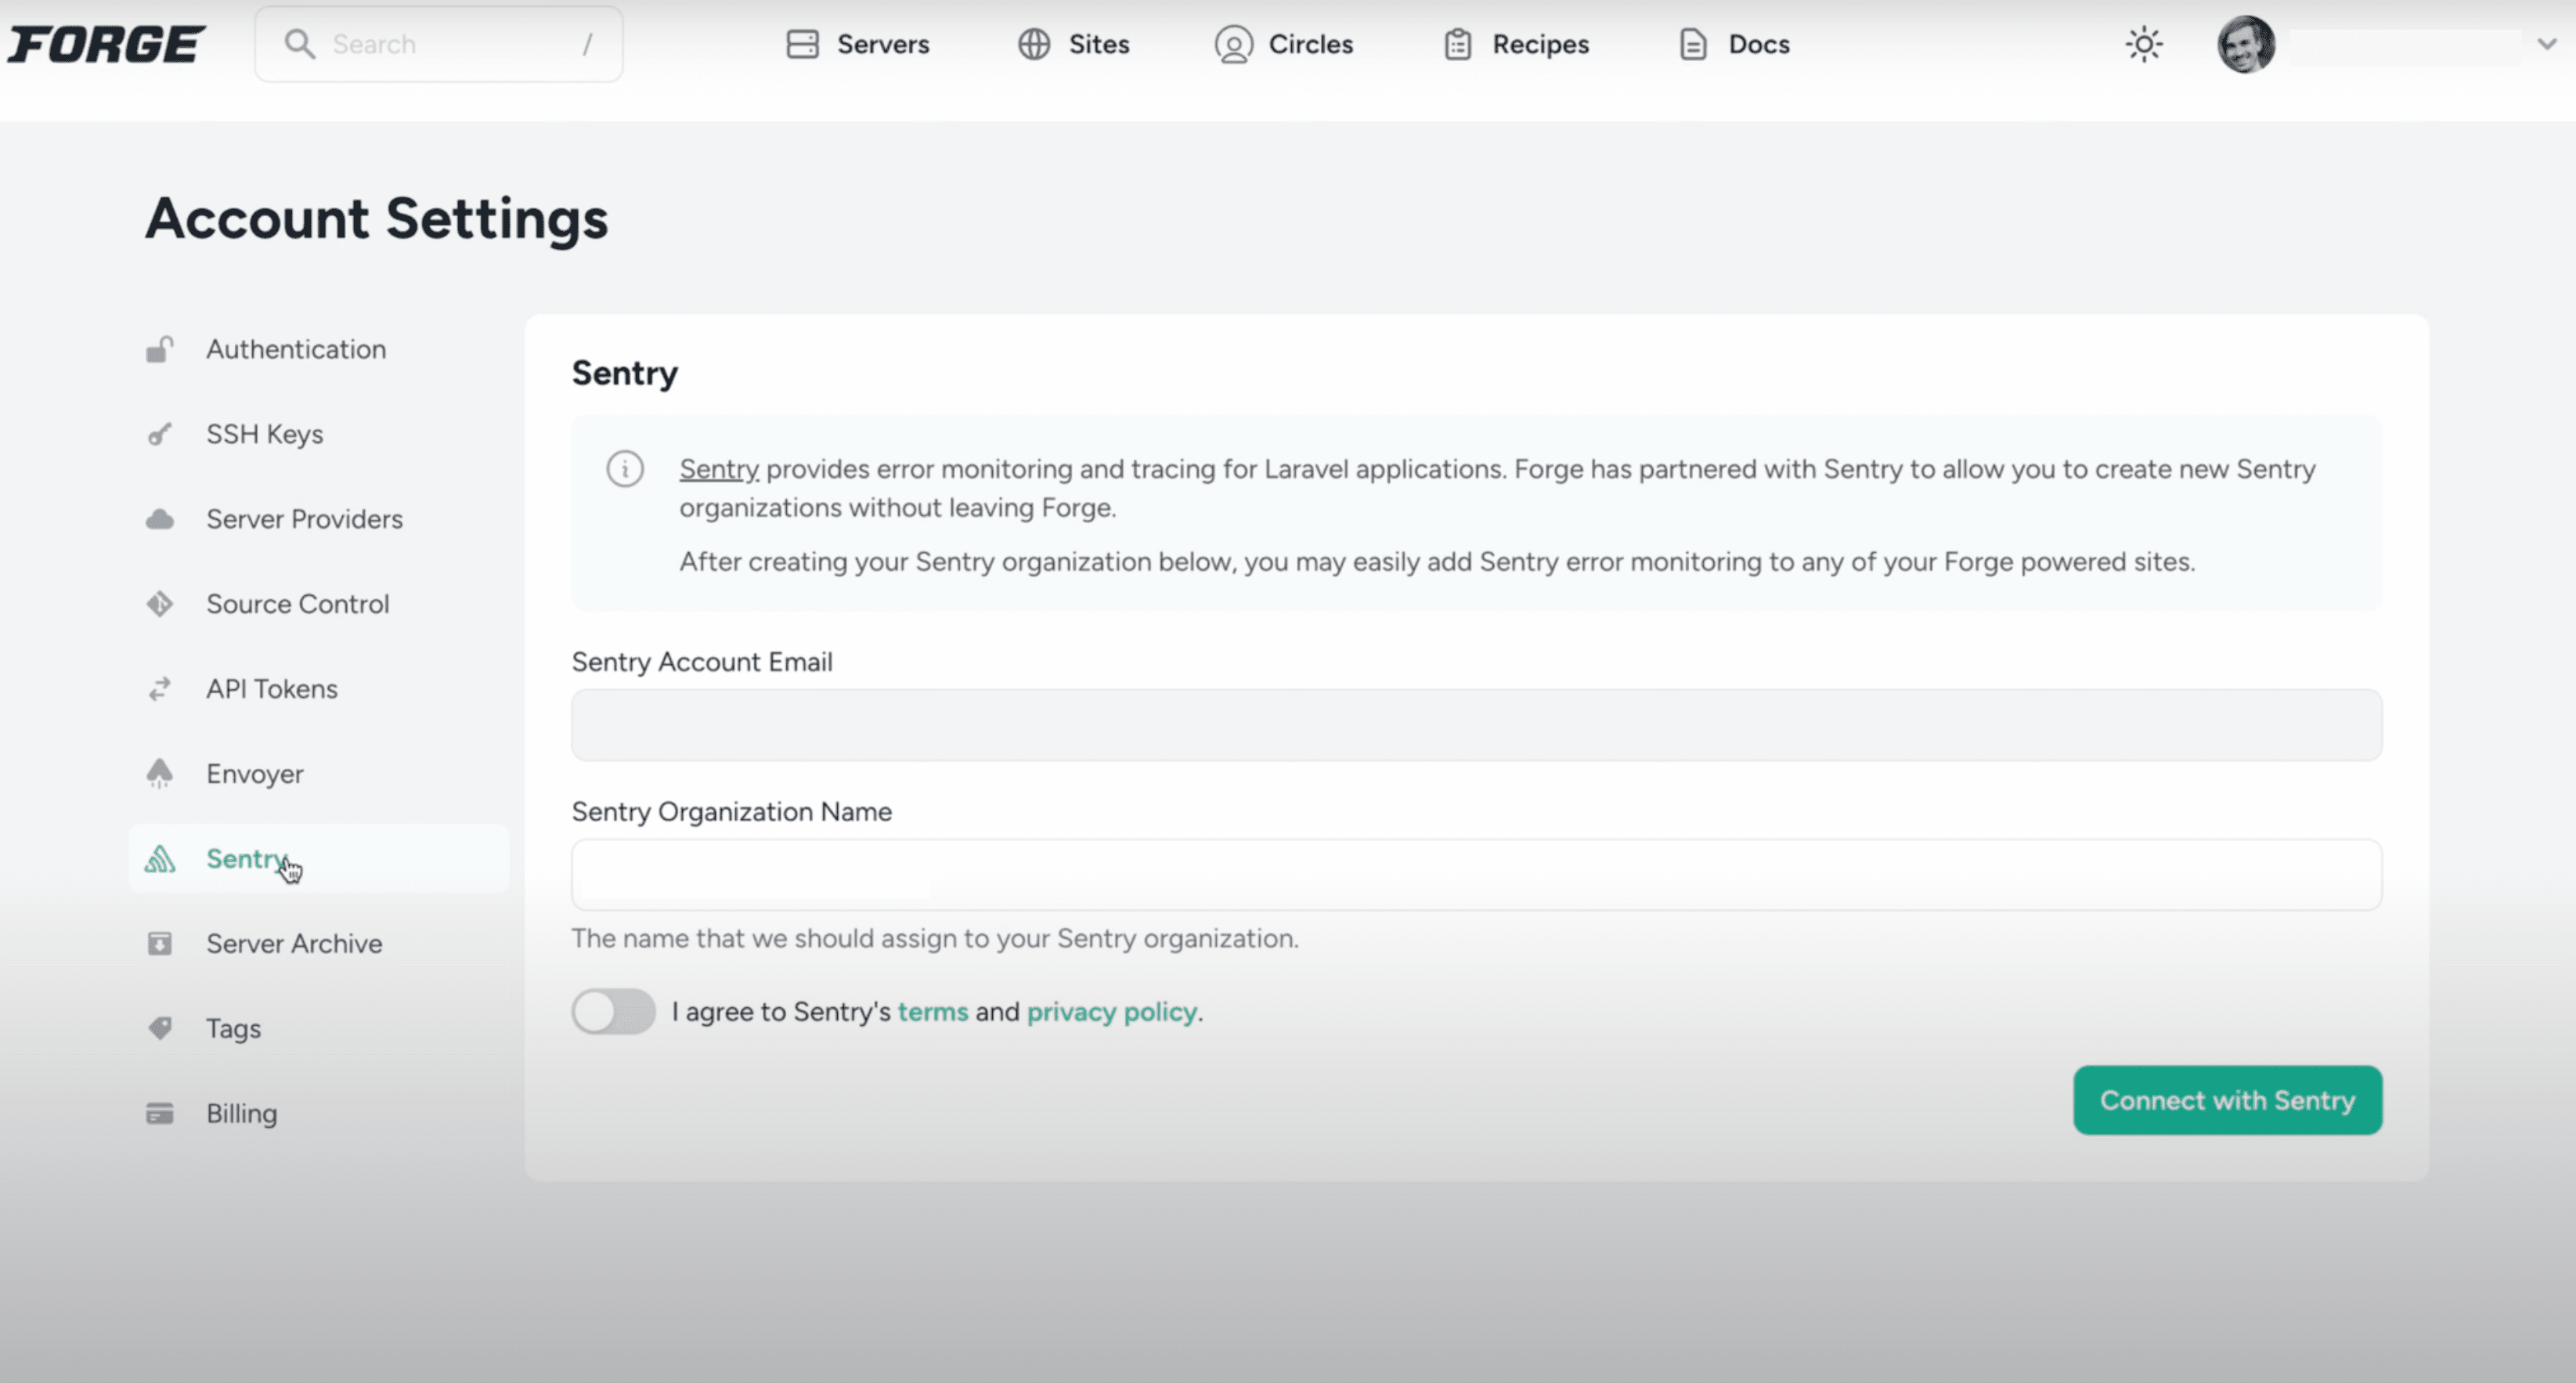
Set up Sentry through Forge
If you're using Laravel's Forge platform to provision and deploy your PHP application, creating your Sentry account is as simple as a few clicks. As a preferred debugging platform for Laravel, you can set up your Sentry organization through Forge.
Sentry gives us a good overview of any possible issues that were caused by a release, and the ability to fix them before they become real problems.”
See the Full Picture of Any Laravel Exception
Aggregate errors by factors like request details, user ID, and app version to see what’s new, a priority, or a trend.
Assign custom key-value tags to reproduce the error environment specific to your application, business, and users.
Find answers to key questions: Was it a code error or usage exception? In which app release did the Laravel bug occur?