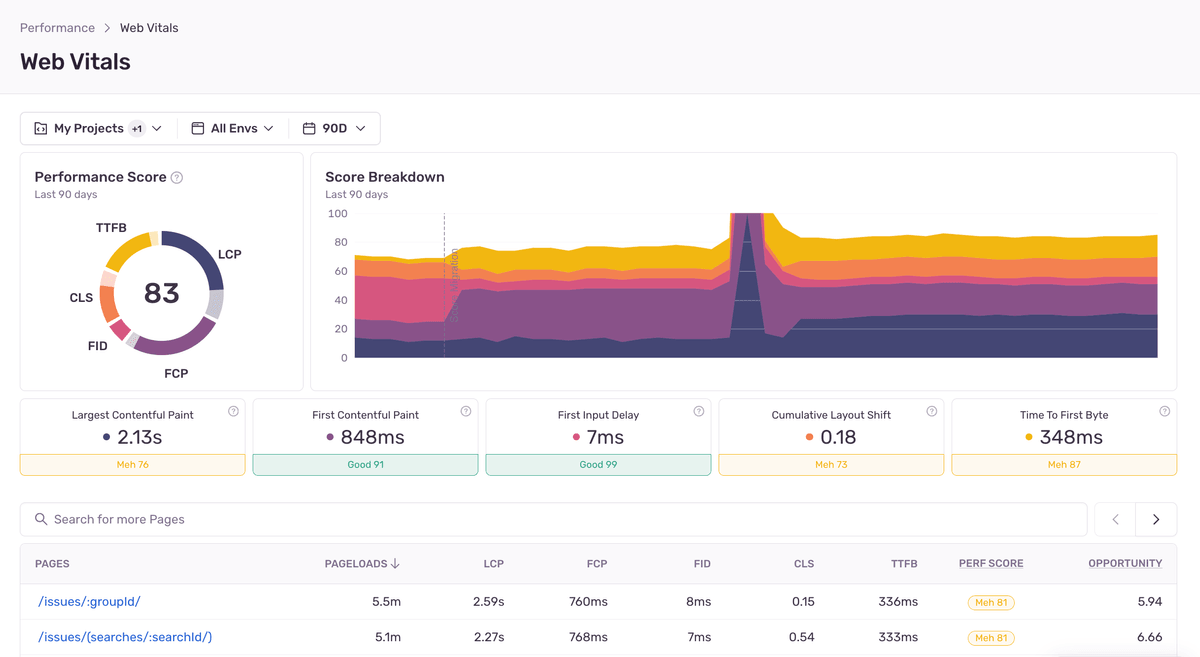
Stay ahead of latency issues and trace every slow transaction to a poor-performing API call or database query. Sentry is the only developer-first application monitoring platform that shows you what’s slow, down to the line of code.
No matter your scale, get full visibility into the performance of your application – while only keeping the data that matters – so you can confidently take action and troubleshoot latency issues before they turn into an outage.
Sentry Performance is built for developers, focused on monitoring code, not system-level changes.
Devs want actionable, not academic context. Sentry Performance gives you details down to the line of code or function to fix.
Integrated into every stage of your release cycle and built to give you curated control and transparency into your app’s performance.
“Unlike past tools we’ve used, Sentry provides the complete picture. No more combing through logs — Sentry makes it incredibly easy to find issues in our code to deliver a much smoother payment experience and a better overall customer experience.”
With just 5 lines of code, you can set up Sentry and start seeing errors and performance issues immediately — no agents or professional services required.
With Sentry, SmugMug was able to catch performance degradations, get alerted, and resolve them before page ranking or discoverability was impacted.
Sentry gives a unified view of your frontend to backend flow. Trace slow-loading pages all the way back to poor-performing API calls — and surface any related errors — to get to root cause faster.
By linking their existing issues with slow-performing endpoints to Sentry, Panenco was able to cut down their API request execution time by 90%.
Left untreated, performance problems can fester and grow into full-blown errors. Taking action (before it’s too late) is easy in Sentry — you can triage, assign, and resolve performance issues directly from your issues feed.
Get alerted on performance issues and performance metrics before the bulk of your users are affected. Sentry pinpoints the exact degradation with no additional effort.
Get visibility across users’ mobile devices to catch the most frustrating performance issues. Sentry automatically collects device information and measures how fast your app starts, the number of slow and frozen frames, and more.
Reduce troubleshooting with Sentry Continuous Profiling, which lets you identify the lines of code consuming excessive CPU and see in production how your application is performing, all on real-user devices.
Monitor your code’s performance at scale for high-fidelity insights into your most critical performance issues— so you and your team can keep hitting SLAs and shipping valuable software.
To further improve workflow, Session Replay gives you a playback of your user sessions so you can see what happened before, during, and after an error or latency issue.
No Agents needed. 5 lines of code is all it takes.
Connect performance issues to the line of code causing latency.
See where your code is slow, so you can fix it.
Align the team on app performance, quality, and release frequency.
Get tips on solving common latency outages, updates on events, and join the conversation on our live streams with our DevRel team.
With code coverage for every major language, save time and angst by proactively finding the source of latency problems without having to manually stitch together user transactions.
People like us on Twitter. For the most part.
Spot the deploy! 📉 This weekend I spent a lot of time thinking about how I can improve the API response time in Noloco. Before I could do that, I had to start measuring response time, which was really easy with @getsentry After all, what gets measured gets managed
Darragh Mc Kay
@darraghmckay
Earlier in the summer I was worried the Slopes server was too slow. Installed @getsentry’s new Laravel performance monitoring to rnd sample calls yesterday. Good to have hard numbers that my code isn’t particularly slow 😄
Curtis Herbert
@parrots
I assumed these Sentry spans were self-satisfied technical wankery on my part, but they really helped fix a perf bug that would've been hard to find. See the ~80 ms gap in this pic — I wasn't sure what it was, but knew it was happening between auth check and remote service call.
Brandur
@brandur
How Tackle Monitors Performance in Serverless: "We continuously use @getsentry to monitor run time errors and API performance so that we can give our developers visibility into real customer experiences."
Tackle
@tackleio
Been playing around with the Distributed Tracing provided by @getsentry some really powerful stuff, already shaved 70ms of one endpoint! #webdev #Python
hishnash
@hishnash
@getsentry is love <3 thanks alot for make my life better haha
Patrick Andrade
@iaipatrick