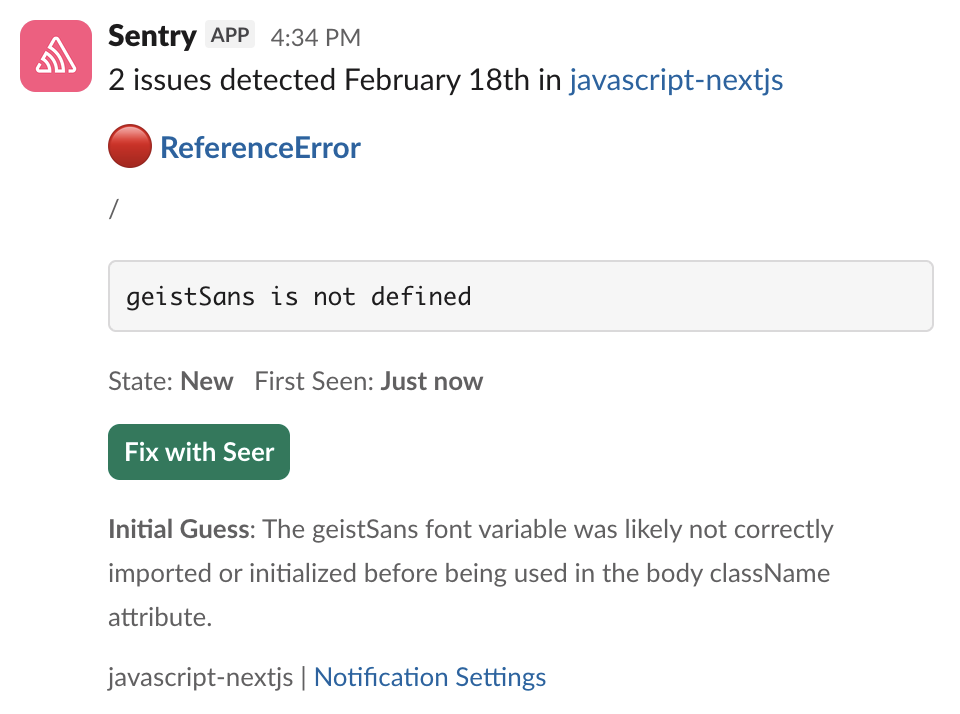
When a new issue hits, Seer investigates automatically to find what broke and why. By the time you open your laptop, there's already a pull request waiting.
Let your issues fix themselves
Sentry has every error, trace, log, replay, and stack trace from your app. Use that production context layer + Seer to automate critical fixes faster.
Tolerated by 4 million developers.
- GitHub
- Disney
- Atlassian
- Linear
- Vercel
- Cloudflare
- Slack
- Metronome
- Autodesk
- Microsoft
- Instacart
- Lyft
- Bolt
- Monday
- Cursor
- Anthropic
- Factory AI
- Sentry
- Baseten
- Runlayer
- Convex
- Supabase
Plain-language answers from your production data.
Whether you have a clean error or just know something's off, describe what you're seeing and Seer Agent investigates across your full telemetry to tell you what's going on and why. Hit Cmd+/ in Sentry to try it, or @Sentry to ask from Slack.
Seer doesn't just live in Sentry's UI.
Send fixes to Claude, Copilot, or Cursor. Fix bugs from a Slack alert. Start an incident investigation in Slack where your whole team can see what's happening.
Seer runs on Sentry's context layer
Sentry already collects every error, trace, log, replay, and profile from your running application. Seer is the AI layer that reasons over all of it. Install the Sentry SDK first, then enable Seer in your org settings.
Signup and install Sentry with just one line of code:
npx @sentry/wizard@latest -i nextjsGrab the Sentry JavaScript SDK:
<script src="https://browser.sentry-cdn.com/<VERSION>/bundle.min.js"></script>Configure your DSN:
Sentry.init({ dsn: 'https://<key>@sentry.io/<project>',
  // This enables automatic instrumentation (highly recommended),
  // but is not necessary for purely manual usage
  // If you only want to use custom instrumentation:
  // * Remove the BrowserTracing integration
  // * add Sentry.addTracingExtensions() above your Sentry.init() call
  integrations: [Sentry.browserTracingIntegration()],

  // We recommend adjusting this value in production, or using tracesSampler
  // for finer control
  tracesSampleRate: 1.0,

  // Set tracePropagationTargets to control for which URLs distributed tracing should be enabled
  tracePropagationTargets: ['localhost', /^https:\/\/yourserver\.io\/api/],
});
Grab the Sentry React SDK:
npm install @sentry/reactConfigure your DSN:
import React from "react";
import ReactDOM from "react-dom";
import * as Sentry from "@sentry/react";
import App from "./App";

Sentry.init({
  dsn: "https://<key>@sentry.io/<project>",
  // This enables automatic instrumentation (highly recommended)
  // If you only want to use custom instrumentation:
  // * Remove the BrowserTracing integration
  // * add Sentry.addTracingExtensions() above your Sentry.init() call
  integrations: [
    Sentry.browserTracingIntegration(),
    // Or, if you are using react router, use the appropriate integration
    // See docs for support for different versions of react router
    // https://docs.sentry.io/platforms/javascript/guides/react/configuration/integrations/react-router/
    Sentry.reactRouterV6BrowserTracingIntegration({
      useEffect: React.useEffect,
      useLocation,
      useNavigationType,
      createRoutesFromChildren,
      matchRoutes,
    }),
  ],

  // For finer control of sent transactions you can adjust this value, or
  // use tracesSampler
  tracesSampleRate: 1.0,

  // Set tracePropagationTargets to control for which URLs distributed tracing should be enabled
  tracePropagationTargets: ['localhost', /^https:\/\/yourserver\.io\/api/],
});

ReactDOM.render(<App />, document.getElementById("root"));
Grab the Sentry Python SDK:
pip install --upgrade sentry-sdkConfigure your DSN:
import sentry_sdk

sentry_sdk.init(
    "https://<key>@sentry.io/<project>",

    # Set traces_sample_rate to 1.0 to capture 100%
    # of transactions for Tracing.
    # We recommend adjusting this value in production.
    traces_sample_rate=1.0,
)
Grab the Sentry Node SDK:
npm install @sentry/nodeConfigure your SDK:
const Sentry = require('@sentry/node');
Sentry.init({ dsn: 'https://<key>@sentry.io/<project>' });
Add the sentry-ruby gem to your Gemfile:
gem "sentry-ruby"Configure your DSN:
Sentry.init do |config|
  config.dsn = 'https://<key>@sentry.io/<project>'

  # Set a uniform sample rate between 0.0 and 1.0
  # We recommend adjusting the value in production:
  config.traces_sample_rate = 1.0

  # or control sampling dynamically
  config.traces_sampler = lambda do |sampling_context|
    # sampling_context[:transaction_context] contains the information about the transaction
    # sampling_context[:parent_sampled] contains the transaction's parent's sample decision
    true # return value can be a boolean or a float between 0.0 and 1.0
  end
end
Grab the Sentry Go SDK:
go get "github.com/getsentry/sentry-go"Configuration should happen as early as possible in your application's lifecycle:
package main

import (
	"log"
	"time"

	"github.com/getsentry/sentry-go"
)

func main() {
	err := sentry.Init(sentry.ClientOptions{
		Dsn: "https://<key>@sentry.io/<project>",
		EnableTracing: true,
		// Specify a fixed sample rate:
		// We recommend adjusting this value in production
		TracesSampleRate: 1.0,
		// Or provide a custom sample rate:
		TracesSampler: sentry.TracesSampler(func(ctx sentry.SamplingContext) float64 {
			// As an example, this does not send some
			// transactions to Sentry based on their name.
			if ctx.Span.Name == "GET /health" {
				return 0.0
			}

			return 1.0
		}),
	})
	if err != nil {
		log.Fatalf("sentry.Init: %s", err)
	}
	// Flush buffered events before the program terminates.
	// Set the timeout to the maximum duration the program can afford to wait.
	defer sentry.Flush(2 * time.Second)
}
Install the sentry/sentry package with Composer:
composer require sentry/sentryTo capture all errors, even the one during the startup of your application, you should initialize the Sentry PHP SDK as soon as possible.
\Sentry\init(['dsn' => 'https://<key>@sentry.io/<project>',
    // Specify a fixed sample rate:
    'traces_sample_rate' => 0.2,
    // Or provide a custom sampler:
    'traces_sampler' => function (\Sentry\Tracing\SamplingContext $context): float {
        // return a number between 0 and 1
    }, ]);
Install the sentry/sentry-laravel package with Composer:
composer require sentry/sentry-laravelAdd Sentry reporting to bootstrap/app.php:
<?php

use Illuminate\Foundation\Application;
use Illuminate\Foundation\Configuration\Exceptions;
use Illuminate\Foundation\Configuration\Middleware;
use Sentry\Laravel\Integration;

return Application::configure(basePath: dirname(__DIR__))
    ->withRouting(
        web: __DIR__.'/../routes/web.php',
        commands: __DIR__.'/../routes/console.php',
        health: '/up',
    )
    ->withMiddleware(function (Middleware $middleware) {
        //
    })
    ->withExceptions(function (Exceptions $exceptions) {
        Integration::handles($exceptions);
    })->create();
Enable Sentry Tracing in config/sentry.php:
// Specify a fixed sample rate:
'traces_sample_rate' => 0.2,
// Or provide a custom sampler:
'traces_sampler' => function (\Sentry\Tracing\SamplingContext $context): float {
    // return a number between 0 and 1
},
Run this Artisan command to configure the Sentry DSN:
php artisan sentry:publish --dsn=<paste-your-DSN-here>Install the NuGet package to add the Sentry dependency:
dotnet add package SentryInitialize the SDK as early as possible, like in the Main method in Program.cs/Program.fs:
using (SentrySdk.Init(o => {
  // Tells which project in Sentry to send events to:
  o.Dsn = "https://<key>@sentry.io/<project>";
  // When configuring for the first time, to see what the SDK is doing:
  o.Debug = true;
  // Set TracesSampleRate to 1.0 to capture 100% of transactions for Tracing.
  // We recommend adjusting this value in production.
  o.TracesSampleRate = 1.0; }))
{
  // App code goes here - Disposing will flush events out
}
Just run this command to sign up for and install Sentry.
brew install getsentry/tools/sentry-wizard && sentry-wizard -i androidTo integrate Sentry into your Xcode project, specify it in your Podfile, then run pod install:
platform :ios, '9.0'
use_frameworks! # This is important

target 'YourApp' do
  pod 'Sentry', :git => 'https://github.com/getsentry/sentry-cocoa.git', :tag => '<VERSION>'
end
Initialize the SDK as soon as possible in your application lifecycle, such as in your AppDelegate application:didFinishLaunchingWithOptions method:
import Sentry // Make sure you import Sentry

func application(_ application: UIApplication,
    didFinishLaunchingWithOptions launchOptions: [UIApplication.LaunchOptionsKey: Any]?) -> Bool {

    SentrySDK.start { options in
        options.dsn = "https://<key>@sentry.io/<project>"
        options.debug = true // Enabled debug when first installing is always helpful
        // Example uniform sample rate: capture 100% of transactions for Tracing
        options.tracesSampleRate = 1.0
    }

    return true
}
Grab the Sentry Vue SDK:
npm install @sentry/vueConfigure your DSN:
import { createApp } from "vue";
import * as Sentry from "@sentry/vue";

const app = createApp({
  // ...
});

Sentry.init({
  app,
  dsn: "https://<key>@sentry.io/<project>",
  // This enables automatic instrumentation (highly recommended),
  // but is not necessary for purely manual usage
  // If you only want to use custom instrumentation:
  // * Remove the BrowserTracing integration
  // * add Sentry.addTracingExtensions() above your Sentry.init() call
  integrations: [Sentry.browserTracingIntegration()],

  // We recommend adjusting this value in production, or using tracesSampler
  // for finer control
  tracesSampleRate: 1.0,
  // Set tracePropagationTargets to control for which URLs distributed tracing should be enabled
  tracePropagationTargets: ['localhost', /^https:\/\/yourserver\.io\/api/],
});

app.mount("#app");
Install with one line of code:
npx @sentry/wizard@latest -i angularGrab the Sentry Java SDK:
<dependency>
  <groupId>io.sentry</groupId>
  <artifactId>sentry-spring-boot-starter</artifactId>
  <version><VERSION></version>
</dependency>
Configure your DSN in application.properties:
sentry.dsn=https://<key>@sentry.io/<project>
# Set traces_sample_rate to 1.0 to capture 100%
# of transactions for performance monitoring.
# We recommend adjusting this value in production.
sentry.traces-sample-rate=1.0
Add the Sentry dependency:
dotnet add package Sentry.AspNetCoreConfigure Sentry in appsettings.json.
"Sentry": {
  "Dsn": "https://examplePublicKey@o0.ingest.sentry.io/0",
  "Debug": true,
},
Then add the SDK by simply calling UseSentry:
public static IHostBuilder CreateHostBuilder(string[] args) =>
    Host.CreateDefaultBuilder(args)
        .ConfigureWebHostDefaults(webBuilder =>
        {
            // Add the following line:
            webBuilder.UseSentry();
        });
To use the SDK, initialize Sentry in your Svelte entry point main.js before you bootstrap your Svelte app:
// main.js / main.ts

import App from "./App.svelte";

import * as Sentry from "@sentry/svelte";

// Initialize the Sentry SDK here
Sentry.init({
  dsn: "__DSN__",
  release: "my-project-name@2.3.12",

  integrations: [Sentry.browserTracingIntegration()],

  // We recommend adjusting this value in production
  tracesSampleRate: 1.0,

  // Set tracePropagationTargets to control for which URLs distributed tracing should be enabled
  tracePropagationTargets: ['localhost', /^https:\/\/yourserver\.io\/api/],
});

// Then bootstrap your Svelte app
const app = new App({
  target: document.getElementById("app"),
});

export default app;
To use the SDK, initialize Sentry in your Solid entry point index.jsx before you render your Solid app:
// index.jsx / index.tsx

import * as Sentry from "@sentry/solid";
import { useBeforeLeave, useLocation } from "@solidjs/router";
import { render } from "solid-js/web";
import App from "./app";

// Initialize the Sentry SDK here
Sentry.init({
  dsn: "__DSN__",
  integrations: [Sentry.browserTracingIntegration()],

  // Performance Monitoring
  tracesSampleRate: 1.0, //  Capture 100% of the transactions
  // Set 'tracePropagationTargets' to control for which URLs trace propagation should be enabled
  tracePropagationTargets: ["localhost", /^https:\/\/yourserver\.io\/api/],
});

const app = document.getElementById("app");

if (!app) throw new Error("No #app element found in the DOM.");

render(() => <App />, app)
Just run this command to install and register Sentry's Astro integration.
npx astro add @sentry/astroAnd add your DSN and project config to your astro.config.mjs file:
import { defineConfig } from "astro/config";
import sentry from "@sentry/astro";

export default defineConfig({
  integrations: [
    sentry({
      dsn: "__DSN__",
      sourceMapsUploadOptions: {
        project: "your-project-slug",
        authToken: process.env.SENTRY_AUTH_TOKEN,
      },
      tracesSampleRate: 1.0,
    }),
  ],
});self-healing software is a thing 🤯
just witnessed Sentry analyzing a session replay video to fix a bug, then raising a PR on its own.
I'm fixing bugs like a madman now.
Sentry [Seer] is actually… good?
One-shot fixed this error that I've spent the last 2 hours debugging.
Seer gives us exactly what we need: straight to the point, fast, and accurate. It's saved us hours per feature, and that translates to the bottom line.
Seer provided insights that led us to a fix within 30 minutes, for a bug that would have taken an engineer at least a day otherwise.
Amazing. @getsentry Seer did better than I would have. I wouldn't have thought to have a special ogType for articles.