Seer Agent already has your errors, traces, logs, and releases. Ask it in plain language why checkout is slow, what changed since the last deploy, or why some requests fail while others don't. No context-gathering, no copy-pasting stack traces, no query languages. Meet Seer Agent.
Ask what's broken. Get the line of code that broke it.
Skip building dashboards and writing queries. Ask Seer, or any agent you already use, what's happening in production. Sentry's answer goes past the spike to the stack trace, the commit that caused it, the person who owns the code, and a fix.
Tolerated by 4 million developers.
- Nextdoor
- Instacart
- Atlassian
- Cisco Meraki
- Disney
- Riot Games
Ask a question. Get an answer from production.
Your agent, your production data.
Already working in Claude Code, Cursor, or another coding agent? Connect it to the Sentry MCP server or the Sentry CLI and ask about production from where you write code. Your agent can pull the issue, read the stack trace and traces, and reason about the cause next to the code it's about to change.
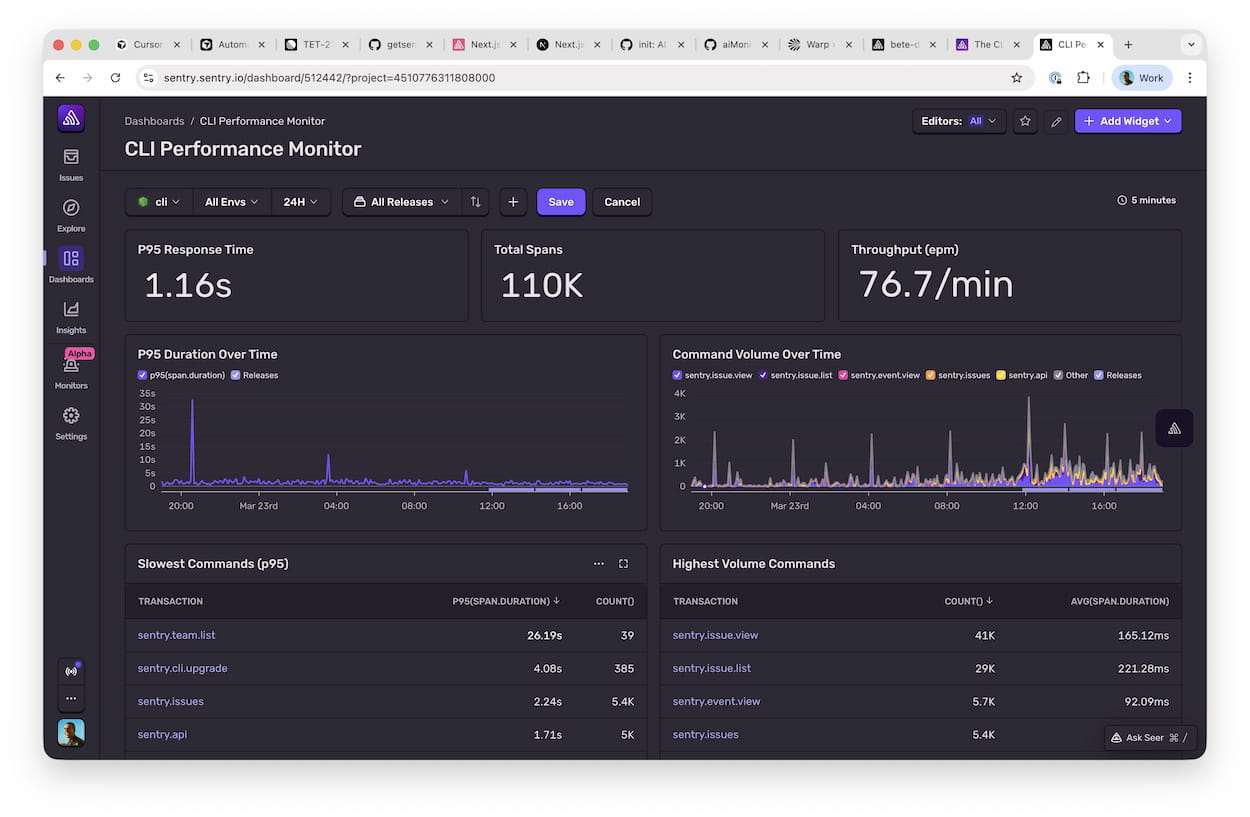
Prompt a dashboard into existence.
When you do want a dashboard, describe it instead of building it. Ask the agent for the view you need and Sentry builds the widgets and queries for you. Your coding agent can do the same from your repo using the Sentry CLI. See how.
Past the telemetry, into the code.
Correlating metrics, logs, and deploys tells you roughly where to look. Sentry's data is organized around your code: errors grouped by root cause, stack traces, suspect commits, and code owners. So Seer's answer names the commit and the line that broke, routes it to the right owner, writes the fix, and can open the pull request.
Better together.
Sentry doesn't do infrastructure monitoring, so if your SRE team runs Grafana and Prometheus, keep them. Send your existing OpenTelemetry traces and logs to Sentry over OTLP with no re-instrumenting, and use the Grafana integration to put Sentry issues and stats on your dashboards.
Sentry's broad SDK coverage empowers Factory to track errors across every customer touchpoint. With their APIs, MCP server, and CLI, errors are easily accessible to our Droids, which can autonomously handle them end-to-end.
Read MoreFactory testimonialSetup in minutes
Install one SDK and get errors, traces, replays, and logs, all connected.
Already using OpenTelemetry? Send your traces and logs over OTLP.
Already using OpenTelemetry? Send your traces and logs over OTLP.
Signup and install Sentry with just one line of code:
Bash
npx @sentry/wizard@latest -i nextjsGrab the Sentry JavaScript SDK:
HTML
<script src="https://browser.sentry-cdn.com/<VERSION>/bundle.min.js"></script>Configure your DSN:
JavaScript
Sentry.init({ dsn: 'https://<key>@sentry.io/<project>',
  // This enables automatic instrumentation (highly recommended),
  // but is not necessary for purely manual usage
  // If you only want to use custom instrumentation:
  // * Remove the BrowserTracing integration
  // * add Sentry.addTracingExtensions() above your Sentry.init() call
  integrations: [Sentry.browserTracingIntegration()],

  // We recommend adjusting this value in production, or using tracesSampler
  // for finer control
  tracesSampleRate: 1.0,

  // Set tracePropagationTargets to control for which URLs distributed tracing should be enabled
  tracePropagationTargets: ['localhost', /^https:\/\/yourserver\.io\/api/],
});
Grab the Sentry React SDK:
Bash
npm install @sentry/reactConfigure your DSN:
JSX
import React from "react";
import ReactDOM from "react-dom";
import * as Sentry from "@sentry/react";
import App from "./App";

Sentry.init({
  dsn: "https://<key>@sentry.io/<project>",
  // This enables automatic instrumentation (highly recommended)
  // If you only want to use custom instrumentation:
  // * Remove the BrowserTracing integration
  // * add Sentry.addTracingExtensions() above your Sentry.init() call
  integrations: [
    Sentry.browserTracingIntegration(),
    // Or, if you are using react router, use the appropriate integration
    // See docs for support for different versions of react router
    // https://docs.sentry.io/platforms/javascript/guides/react/features/react-router/
    Sentry.reactRouterV6BrowserTracingIntegration({
      useEffect: React.useEffect,
      useLocation,
      useNavigationType,
      createRoutesFromChildren,
      matchRoutes,
    }),
  ],

  // For finer control of sent transactions you can adjust this value, or
  // use tracesSampler
  tracesSampleRate: 1.0,

  // Set tracePropagationTargets to control for which URLs distributed tracing should be enabled
  tracePropagationTargets: ['localhost', /^https:\/\/yourserver\.io\/api/],
});

ReactDOM.render(<App />, document.getElementById("root"));
Grab the Sentry Python SDK:
Bash
pip install --upgrade sentry-sdkConfigure your DSN:
Python
import sentry_sdk

sentry_sdk.init(
    "https://<key>@sentry.io/<project>",

    # Set traces_sample_rate to 1.0 to capture 100%
    # of transactions for Tracing.
    # We recommend adjusting this value in production.
    traces_sample_rate=1.0,
)
Grab the Sentry Node SDK:
Bash
npm install @sentry/nodeConfigure your SDK:
JavaScript
const Sentry = require('@sentry/node');
Sentry.init({ dsn: 'https://<key>@sentry.io/<project>' });
Add the sentry-ruby gem to your Gemfile:
Ruby
gem "sentry-ruby"Configure your DSN:
Ruby
Sentry.init do |config|
  config.dsn = 'https://<key>@sentry.io/<project>'

  # Set a uniform sample rate between 0.0 and 1.0
  # We recommend adjusting the value in production:
  config.traces_sample_rate = 1.0

  # or control sampling dynamically
  config.traces_sampler = lambda do |sampling_context|
    # sampling_context[:transaction_context] contains the information about the transaction
    # sampling_context[:parent_sampled] contains the transaction's parent's sample decision
    true # return value can be a boolean or a float between 0.0 and 1.0
  end
end
Grab the Sentry Go SDK:
Bash
go get "github.com/getsentry/sentry-go"Configuration should happen as early as possible in your application's lifecycle:
Go
package main

import (
	"log"
	"time"

	"github.com/getsentry/sentry-go"
)

func main() {
	err := sentry.Init(sentry.ClientOptions{
		Dsn: "https://<key>@sentry.io/<project>",
		EnableTracing: true,
		// Specify a fixed sample rate:
		// We recommend adjusting this value in production
		TracesSampleRate: 1.0,
		// Or provide a custom sample rate:
		TracesSampler: sentry.TracesSampler(func(ctx sentry.SamplingContext) float64 {
			// As an example, this does not send some
			// transactions to Sentry based on their name.
			if ctx.Span.Name == "GET /health" {
				return 0.0
			}

			return 1.0
		}),
	})
	if err != nil {
		log.Fatalf("sentry.Init: %s", err)
	}
	// Flush buffered events before the program terminates.
	// Set the timeout to the maximum duration the program can afford to wait.
	defer sentry.Flush(2 * time.Second)
}
Install the sentry/sentry package with Composer:
Bash
composer require sentry/sentryTo capture all errors, even the one during the startup of your application, you should initialize the Sentry PHP SDK as soon as possible.
PHP
\Sentry\init(['dsn' => 'https://<key>@sentry.io/<project>',
    // Specify a fixed sample rate:
    'traces_sample_rate' => 0.2,
    // Or provide a custom sampler:
    'traces_sampler' => function (\Sentry\Tracing\SamplingContext $context): float {
        // return a number between 0 and 1
    }, ]);
Install the sentry/sentry-laravel package with Composer:
Bash
composer require sentry/sentry-laravelAdd Sentry reporting to bootstrap/app.php:
PHP
<?php

use Illuminate\Foundation\Application;
use Illuminate\Foundation\Configuration\Exceptions;
use Illuminate\Foundation\Configuration\Middleware;
use Sentry\Laravel\Integration;

return Application::configure(basePath: dirname(__DIR__))
    ->withRouting(
        web: __DIR__.'/../routes/web.php',
        commands: __DIR__.'/../routes/console.php',
        health: '/up',
    )
    ->withMiddleware(function (Middleware $middleware) {
        //
    })
    ->withExceptions(function (Exceptions $exceptions) {
        Integration::handles($exceptions);
    })->create();
Enable Sentry Tracing in config/sentry.php:
PHP
// Specify a fixed sample rate:
'traces_sample_rate' => 0.2,
// Or provide a custom sampler:
'traces_sampler' => function (\Sentry\Tracing\SamplingContext $context): float {
    // return a number between 0 and 1
},
Run this Artisan command to configure the Sentry DSN:
Bash
php artisan sentry:publish --dsn=<paste-your-DSN-here>Install the NuGet package to add the Sentry dependency:
Bash
dotnet add package SentryInitialize the SDK as early as possible, like in the Main method in Program.cs/Program.fs:
C#
using (SentrySdk.Init(o => {
  // Tells which project in Sentry to send events to:
  o.Dsn = "https://<key>@sentry.io/<project>";
  // When configuring for the first time, to see what the SDK is doing:
  o.Debug = true;
  // Set TracesSampleRate to 1.0 to capture 100% of transactions for Tracing.
  // We recommend adjusting this value in production.
  o.TracesSampleRate = 1.0; }))
{
  // App code goes here - Disposing will flush events out
}
Just run this command to sign up for and install Sentry.
Bash
brew install getsentry/tools/sentry-wizard && sentry-wizard -i androidTo integrate Sentry into your Xcode project, specify it in your Podfile, then run pod install:
Ruby
platform :ios, '9.0'
use_frameworks! # This is important

target 'YourApp' do
  pod 'Sentry', :git => 'https://github.com/getsentry/sentry-cocoa.git', :tag => '<VERSION>'
end
Initialize the SDK as soon as possible in your application lifecycle, such as in your AppDelegate application:didFinishLaunchingWithOptions method:
Swift
import Sentry // Make sure you import Sentry

func application(_ application: UIApplication,
    didFinishLaunchingWithOptions launchOptions: [UIApplication.LaunchOptionsKey: Any]?) -> Bool {

    SentrySDK.start { options in
        options.dsn = "https://<key>@sentry.io/<project>"
        options.debug = true // Enabled debug when first installing is always helpful
        // Example uniform sample rate: capture 100% of transactions for Tracing
        options.tracesSampleRate = 1.0
    }

    return true
}
Grab the Sentry Vue SDK:
Bash
npm install @sentry/vueConfigure your DSN:
JavaScript
import { createApp } from "vue";
import * as Sentry from "@sentry/vue";

const app = createApp({
  // ...
});

Sentry.init({
  app,
  dsn: "https://<key>@sentry.io/<project>",
  // This enables automatic instrumentation (highly recommended),
  // but is not necessary for purely manual usage
  // If you only want to use custom instrumentation:
  // * Remove the BrowserTracing integration
  // * add Sentry.addTracingExtensions() above your Sentry.init() call
  integrations: [Sentry.browserTracingIntegration()],

  // We recommend adjusting this value in production, or using tracesSampler
  // for finer control
  tracesSampleRate: 1.0,
  // Set tracePropagationTargets to control for which URLs distributed tracing should be enabled
  tracePropagationTargets: ['localhost', /^https:\/\/yourserver\.io\/api/],
});

app.mount("#app");
Install with one line of code:
Bash
npx @sentry/wizard@latest -i angularGrab the Sentry Java SDK:
XML
<dependency>
  <groupId>io.sentry</groupId>
  <artifactId>sentry-spring-boot-starter</artifactId>
  <version><VERSION></version>
</dependency>
Configure your DSN in application.properties:
Java
sentry.dsn=https://<key>@sentry.io/<project>
# Set traces_sample_rate to 1.0 to capture 100%
# of transactions for performance monitoring.
# We recommend adjusting this value in production.
sentry.traces-sample-rate=1.0
Add the Sentry dependency:
Bash
dotnet add package Sentry.AspNetCoreConfigure Sentry in appsettings.json.
JavaScript
"Sentry": {
  "Dsn": "https://examplePublicKey@o0.ingest.sentry.io/0",
  "Debug": true,
},
Then add the SDK by simply calling UseSentry:
C#
public static IHostBuilder CreateHostBuilder(string[] args) =>
    Host.CreateDefaultBuilder(args)
        .ConfigureWebHostDefaults(webBuilder =>
        {
            // Add the following line:
            webBuilder.UseSentry();
        });
To use the SDK, initialize Sentry in your Svelte entry point main.js before you bootstrap your Svelte app:
JavaScript
// main.js / main.ts

import App from "./App.svelte";

import * as Sentry from "@sentry/svelte";

// Initialize the Sentry SDK here
Sentry.init({
  dsn: "__DSN__",
  release: "my-project-name@2.3.12",

  integrations: [Sentry.browserTracingIntegration()],

  // We recommend adjusting this value in production
  tracesSampleRate: 1.0,

  // Set tracePropagationTargets to control for which URLs distributed tracing should be enabled
  tracePropagationTargets: ['localhost', /^https:\/\/yourserver\.io\/api/],
});

// Then bootstrap your Svelte app
const app = new App({
  target: document.getElementById("app"),
});

export default app;
To use the SDK, initialize Sentry in your Solid entry point index.jsx before you render your Solid app:
JSX
// index.jsx / index.tsx

import * as Sentry from "@sentry/solid";
import { useBeforeLeave, useLocation } from "@solidjs/router";
import { render } from "solid-js/web";
import App from "./app";

// Initialize the Sentry SDK here
Sentry.init({
  dsn: "__DSN__",
  integrations: [Sentry.browserTracingIntegration()],

  // Performance Monitoring
  tracesSampleRate: 1.0, //  Capture 100% of the transactions
  // Set 'tracePropagationTargets' to control for which URLs trace propagation should be enabled
  tracePropagationTargets: ["localhost", /^https:\/\/yourserver\.io\/api/],
});

const app = document.getElementById("app");

if (!app) throw new Error("No #app element found in the DOM.");

render(() => <App />, app)
Just run this command to install and register Sentry's Astro integration.
Bash
npx astro add @sentry/astroAnd add your DSN and project config to your astro.config.mjs file:
JavaScript
import { defineConfig } from "astro/config";
import sentry from "@sentry/astro";

export default defineConfig({
  integrations: [
    sentry({
      dsn: "__DSN__",
      sourceMapsUploadOptions: {
        project: "your-project-slug",
        authToken: process.env.SENTRY_AUTH_TOKEN,
      },
      tracesSampleRate: 1.0,
    }),
  ],
});