Detect and monitor critical issues from the system to the code level
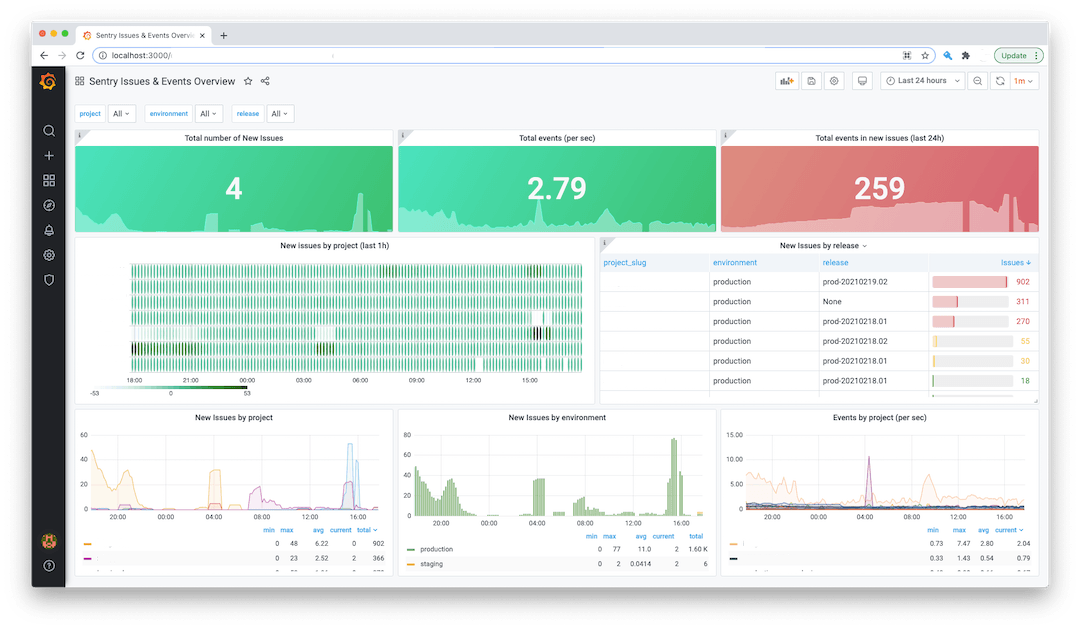
Couple your infrastructure data via Prometheus with Sentry Issue and Stats data, so you can easily visualize the most important metrics for your application in a single dashboard.
Resolve issues faster by not searching through logs
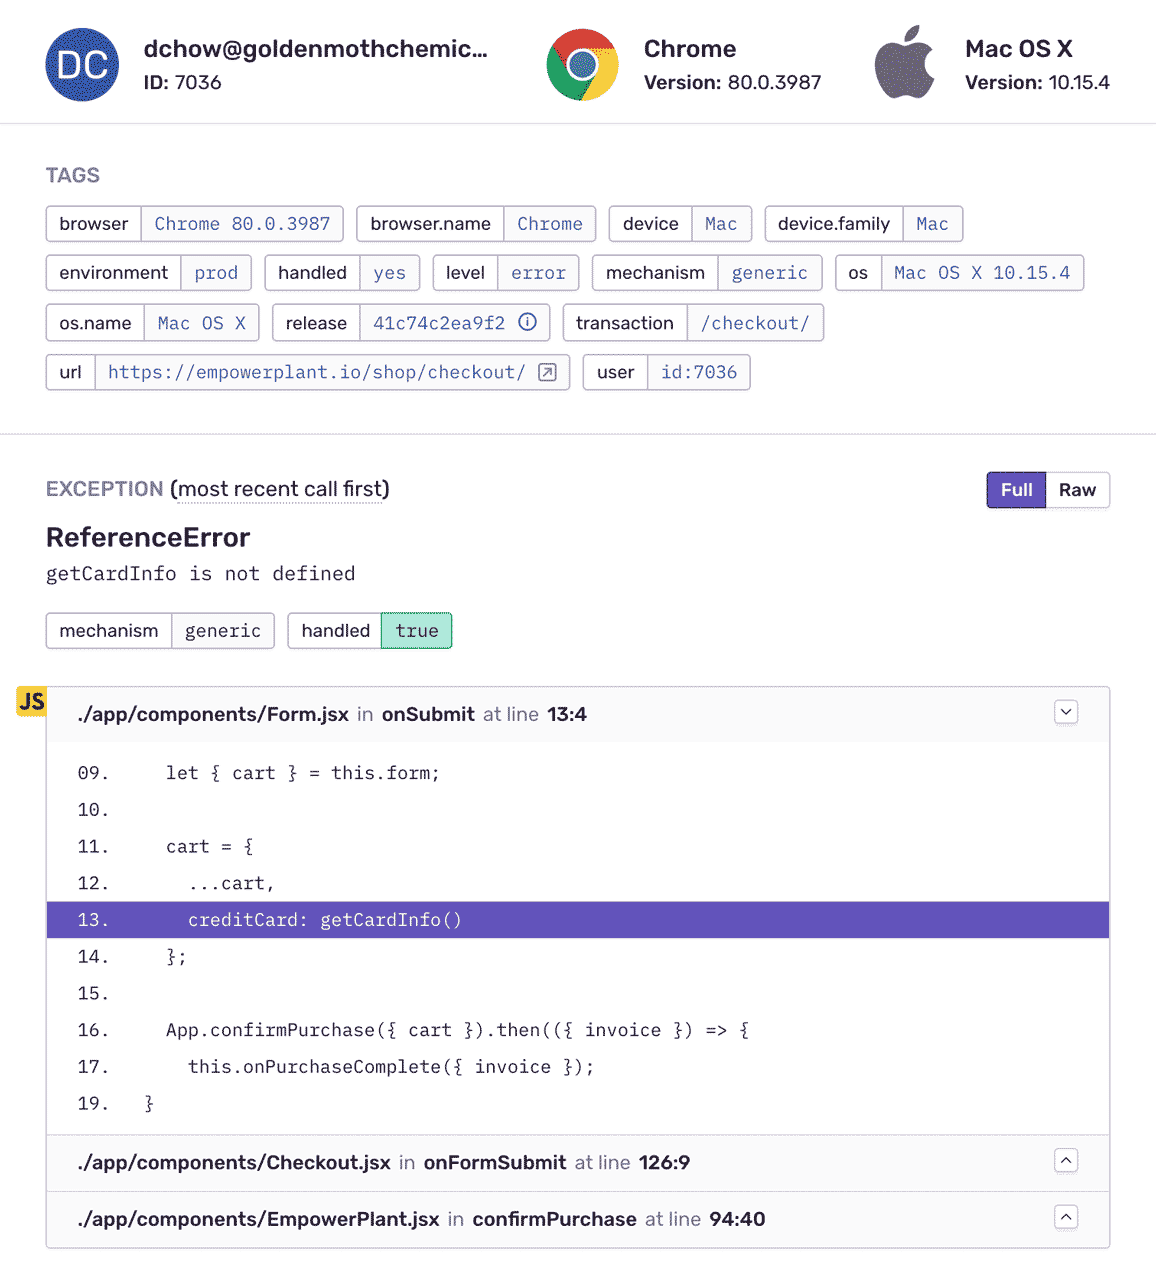
Take action quickly with a deep link from your Grafana dashboard to the issue details in Sentry so you can quickly pinpoint when, where, and why a user experiences an issue— and who owns the broken code.
Track software health and measure business impact
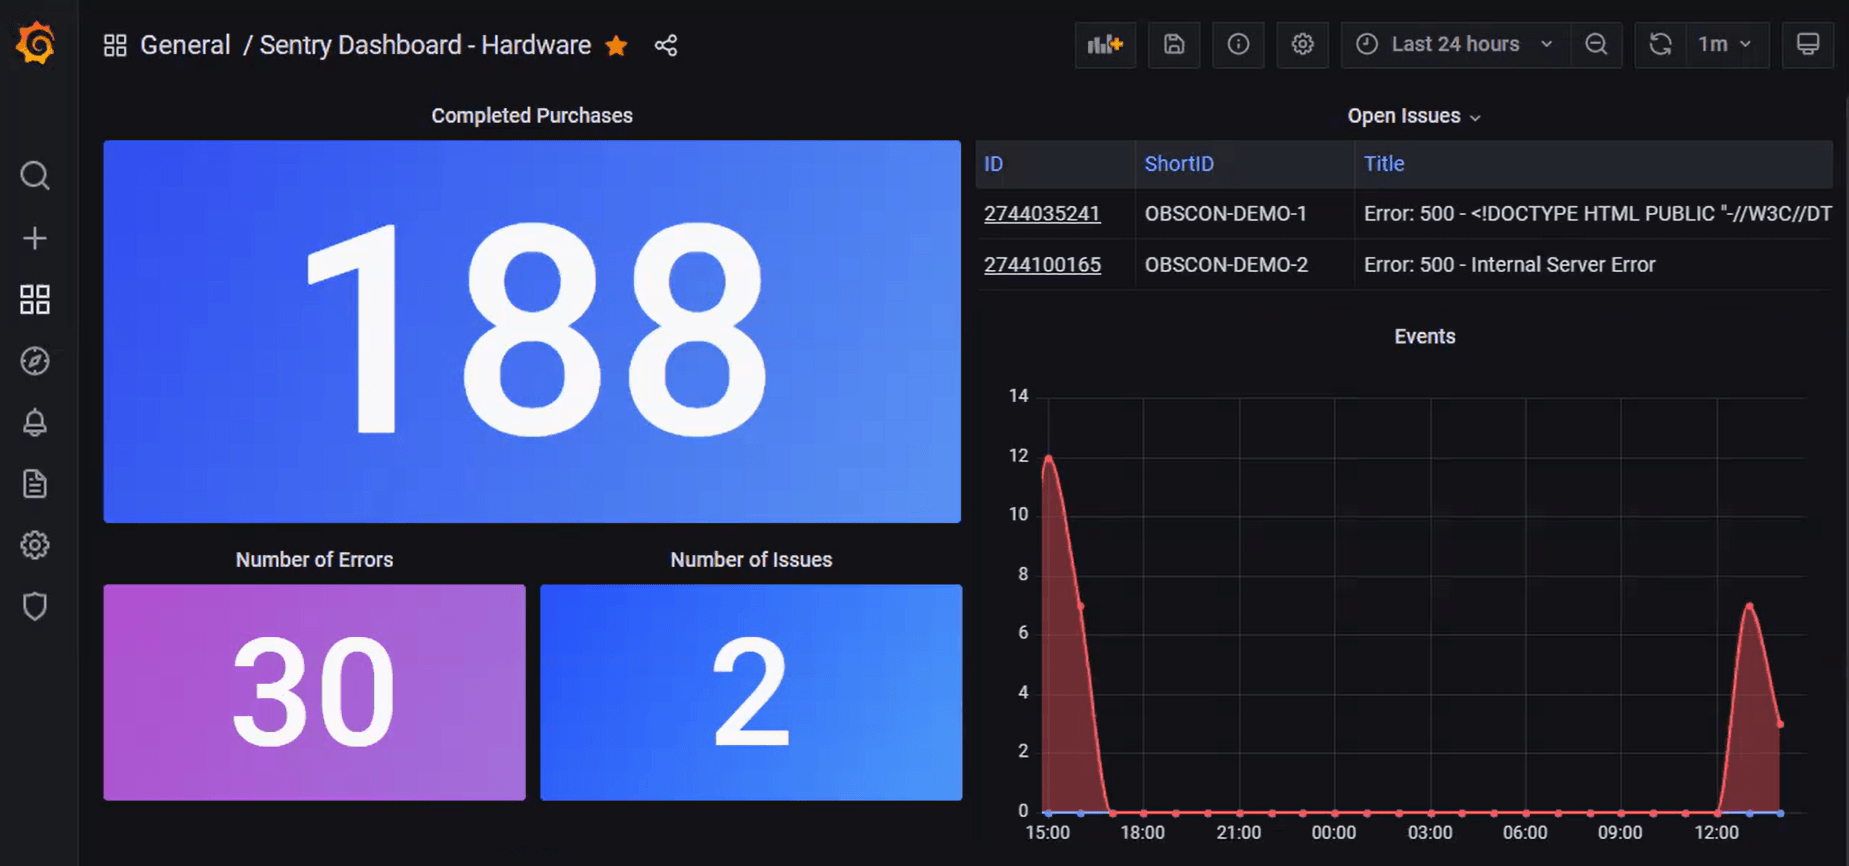
By combining your software and business health into a single view, you can answer questions like "Are issues with my website impacting sales?" or "How quickly is my team resolving issues connected to support tickets?"
Is your data secure? You better believe it.
Just look at all the high-quality security features all accounts get, regardless of plan.
- Two-Factor Auth
- Single Sign-On support
- Organization audit log
- SOC 2 Type II and ISO 27001 certified
- HIPAA attestation
- PII data scrubbing
- SSL encryption
- Data Processing Addendum (includes latest EU SCCs)
- Privacy Shield certified
All errors, one place
Use Sentry to collect and process errors from clients and connected projects. We support all major platforms.


