
About Faros AI
Faros is a software engineering intelligence platform that enables the enterprise’s transformation to data-driven engineering.
Founded by the Salesforce Einstein engineering team, Faros AI provides cross-organizational visibility into the most important engineering metrics around productivity, DevOps, quality, and team health, and helps ensure consistency in what gets measured and prioritized at every level. By intelligently stitching dozens of data sources together, Faros provides game-changing analytics that boost speed, efficiency, quality, engagement, and business impact.
Faros is trusted by leading software companies including Salesforce, BetterHelp, Box, Coursera, and Firstbase.
Results:
- Enhanced front-end / client-side performance visibility
- Improved quality-of-service to customers
- Time saved from no longer doing manual log and trace analysis
- Streamlined incident management
Enhancing developer productivity, starting with Error Tracking
Sentry has been an integral part of the Faros engineering team’s developer productivity toolkit for 2+ years. Faros first adopted Sentry to automate error reporting for the client-side and backend of their Next.js-based application, then expanded to end-to-end and integration tests.
The Faros platform has a scalable multi-tenant SaaS architecture comprising microservices built on a variety of open source technologies, including:
- Data ingestion layer built on OSS Airbyte
- Data transformations done with dbt core
- GraphQL APIs based on OSS Hasura
- Data visualization/BI layer based on Metabase, in which Metabase’s frontend is implemented in React/JS and backend is written in Clojure
Recently, Faros integrated Sentry with the Metabase UI app to track individual backend requests and monitor real user experience. With Sentry Performance, Faros can now track overall page load times experienced by their users, including for individual components of a page.
Increasing visibility into client-side performance issues
Faros’s engineering team has extensive expertise in data management pipelines and handling large amounts of data. They are committed to providing best-in-class experience for their users. With their rapid growth in customers, the Faros team increased their focus on prioritizing platform bottlenecks and enhancing user experience.
With Sentry instrumentation already in place on the frontend, Faros was able to easily unlock Sentry Performance by making a few adjustments to their backend service configuration. Since Metabase dashboards and the app are embedded in Faros’s main application via an iframe architecture, direct Sentry instrumentation wasn’t possible; instead, Faros separately instrumented the Metabase UI via their custom fork of Metabase.
With Sentry Performance, Faros gained a comprehensive end-to-end view of their app’s performance from the perspective of their customers. The dashboards they’ve created in Sentry to track page load and navigation times have been invaluable for monitoring performance improvements and detecting regressions. By keeping an eye on page load speeds, Faros ensures that slowdowns are caught and fixed before their enterprise customers are impacted.
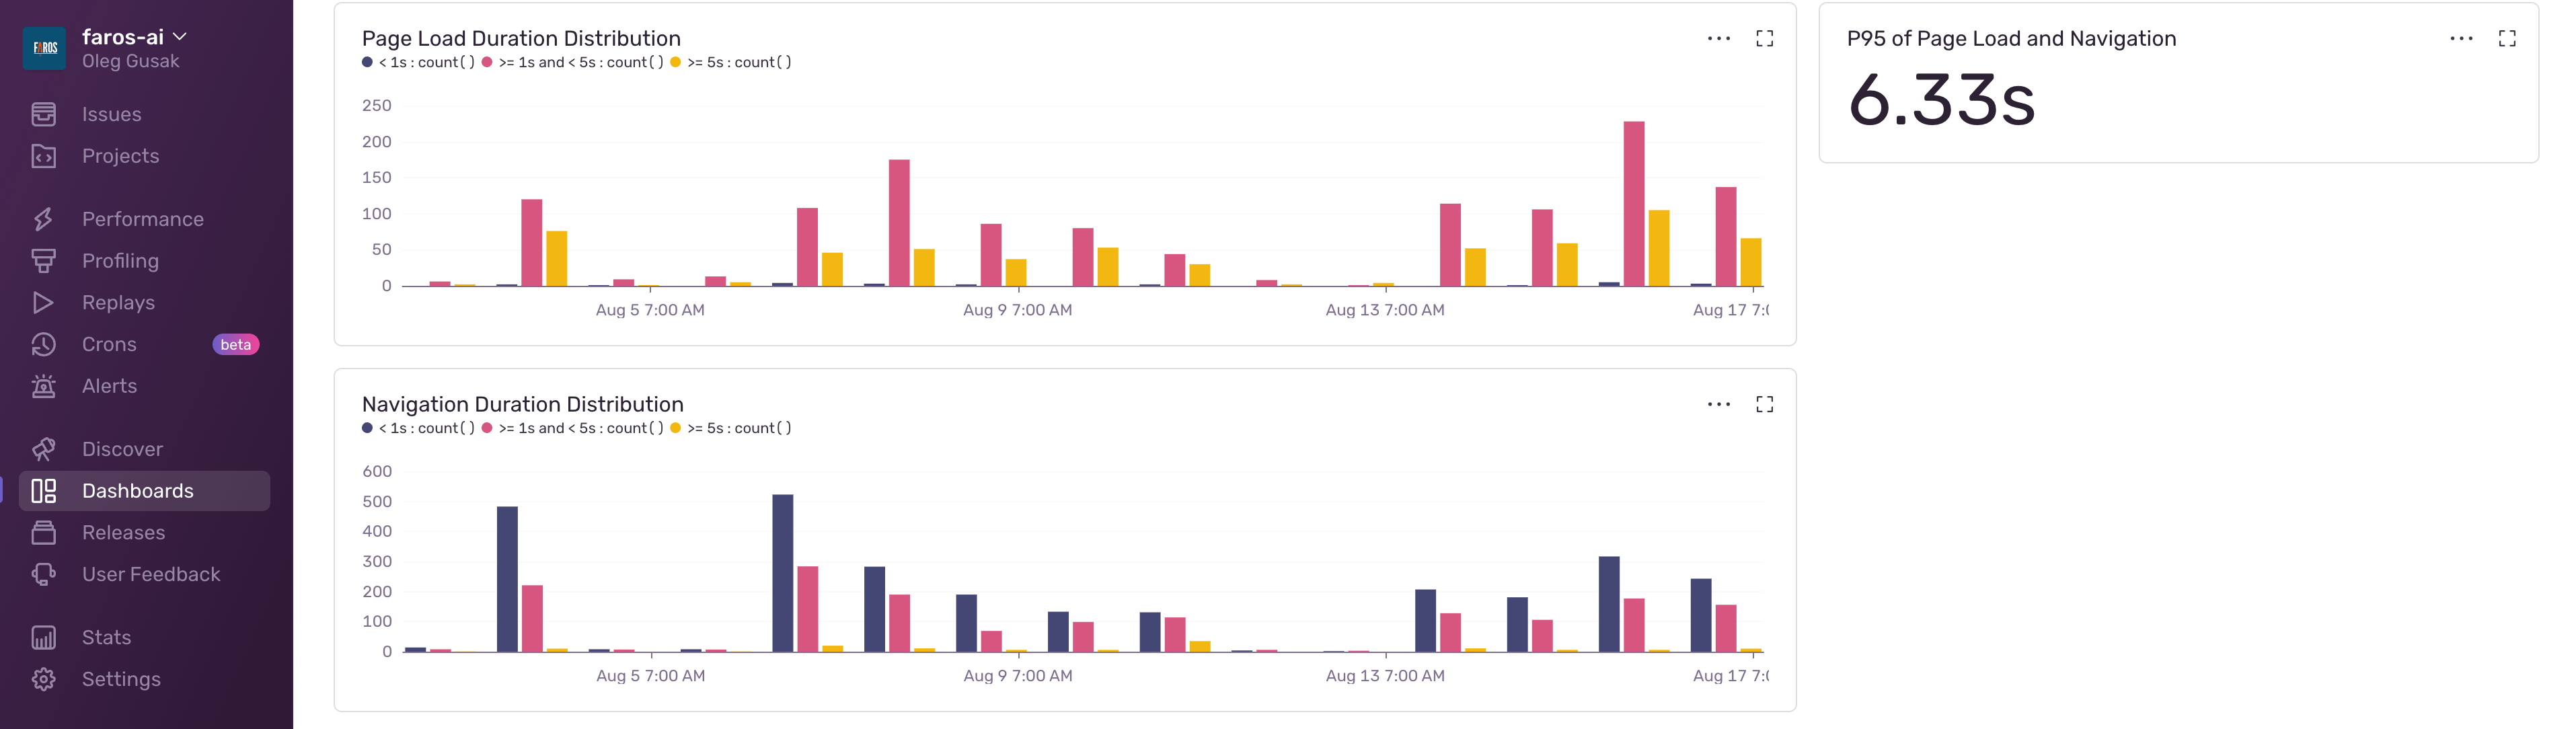
Oleg Gusak, Lead Engineer for Infrastructure and Performance at Faros, summarizes it aptly: “With Sentry, we are able to track and report weekly on the end-user experience of our app. We rely on Sentry to monitor our progress toward our defined performance goals — week-over-week 95th percentile of page load and page navigation times — and to investigate any regressions that might have occurred.”
Speeding up incident resolution by identifying the most impacted customers
Real user monitoring (i.e. front-end performance monitoring) with Sentry has helped Faros maintain a high quality of service for customers and troubleshoot production incidents effectively. One of Sentry’s key strengths is its access to session context. With out-of-the-box configuration, Sentry automatically tags transactions with tenant, user, and other data, enabling Faros to analyze client-side performance in various dimensions.
Faros investigates performance regressions by starting in the Performance section of Sentry’s UI and using a simple flow:
- First, see a breakdown of transactions by URI in the Transaction Summary and sort by their volume or aggregated response time.
- From this page, drill down to a specific transaction type (e.g., the URI with the highest P95 of page load time) and then see a list of individual events that contributed to the aggregate page load time.
- Navigate to Sentry’s Discover feature, where events can be filtered and summarized by their tags, for more detailed analysis.
Because the Faros application serves a diverse range of tenants with varying data shapes, app response times can fluctuate significantly. Sentry has helped Faros pinpoint and attribute regressions to specific customers/users.
How Faros Solved a Recent Incident with Sentry Performance
Just last week, Lead Engineer Oleg Gusak was on call and received a Pagerduty alert about a spike in app response time in their dashboards. Sentry was the first place Oleg went to investigate why the spike was occurring, as it provided transaction-level details that pointed to the answer:
“With Sentry, I could identify the transactions, tenants, and users that were affected and contributed to the spike that triggered the alert. Knowing just the API endpoint that caused the regression was not sufficient, since response time heavily depends on the data shape unique to each tenant.”
“The tenant information from Sentry was crucial. The open source components in our architecture lack tenant awareness. Hence, without Sentry, we’d have to resort to tracing database calls from backend services and then analyze the logs to identify the tenant and user for each request, a much more time-consuming operation than just navigating Sentry’s Performance UI.”
By utilizing API endpoint names and tenant information, Faros could immediately reproduce the long page load time, debug the issue, and put in place the relevant optimizations..
What’s Next for Faros
For their performance monitoring needs in the future, Faros is looking forward to a more advanced data querying/visualization layer which would help streamline data analysis. To complement their current workflow, they’d also like to gain more insight into why a regression may have happened using week-over-week comparison with built-in analytics.
In the long term, they aim to integrate Sentry’s client-side performance monitoring with back-end APM and tracing solutions. By consolidating end-to-end performance data for the Faros platform, they would simplify and shorten the time-to-resolution of any incidents/regressions and consequently improve quality of service to their customers.