
iOS Error Tracking & Performance Monitoring
Actionable insights to resolve iOS performance bottlenecks and errors. Improve your monitoring workflow with a full view of releases so you can mark iOS errors as resolved and prioritize live issues.
Getting Started is Simple
Just run this commmand to sign up for and install Sentry.
brew install getsentry/tools/sentry-wizard && sentry-wizard -i ios
And then to setup Sentry Tracing add the below code snippet.
import Sentry

SentrySDK.start { options in
    options.dsn = "https://examplePublicKey@o0.ingest.sentry.io/0"

    // Example uniform sample rate: capture 100% of transactions
    // In Production you will probably want a smaller number such as 0.5 for 50%
    options.tracesSampleRate = 1.0

    // OR if you prefer, determine traces sample rate based on the
    // sampling context
    options.tracesSampler = { context in
         // Don't miss any transactions for VIP users
        if context?["vip"] as? Bool == true {
            return 1.0
        } else {
            return 0.25 // 25% for everything else
        }
    }
}
Check our documentation for the latest instructions.
See all platforms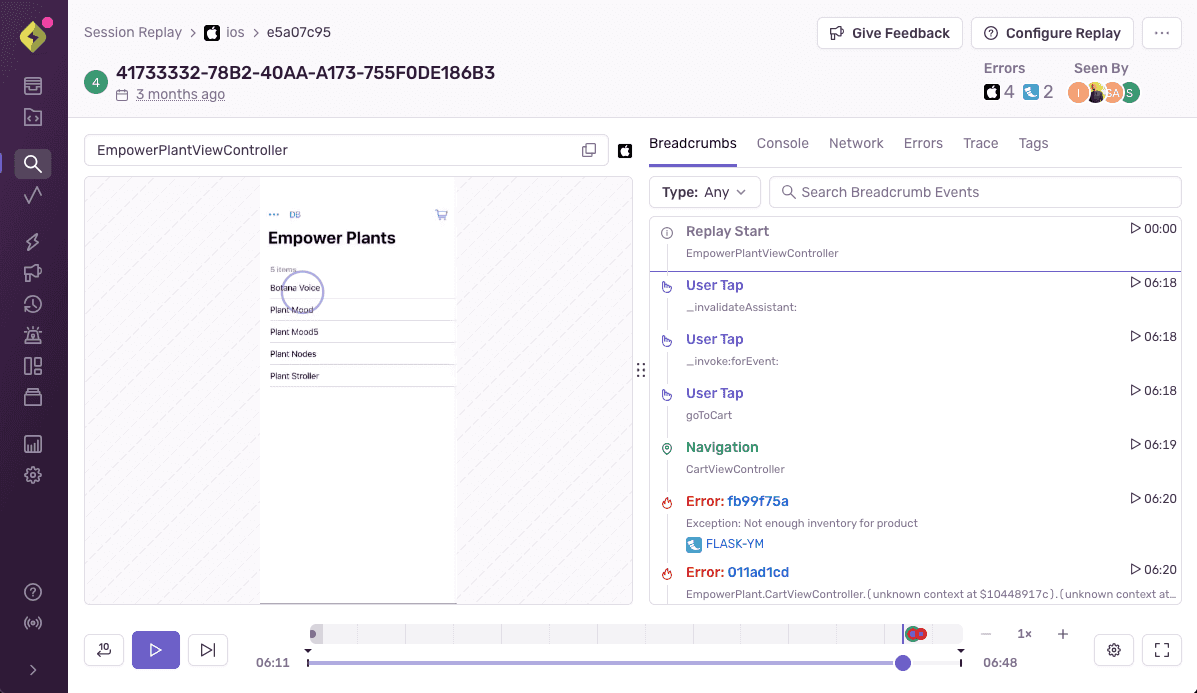
Session Replay
Get to the root cause of an issue faster by watching replays of real user sessions with best-in-class privacy controls. Understand when, where, and how an error is impacting your app without having to repro it yourself, talk to a customer, or expose sensitive data.
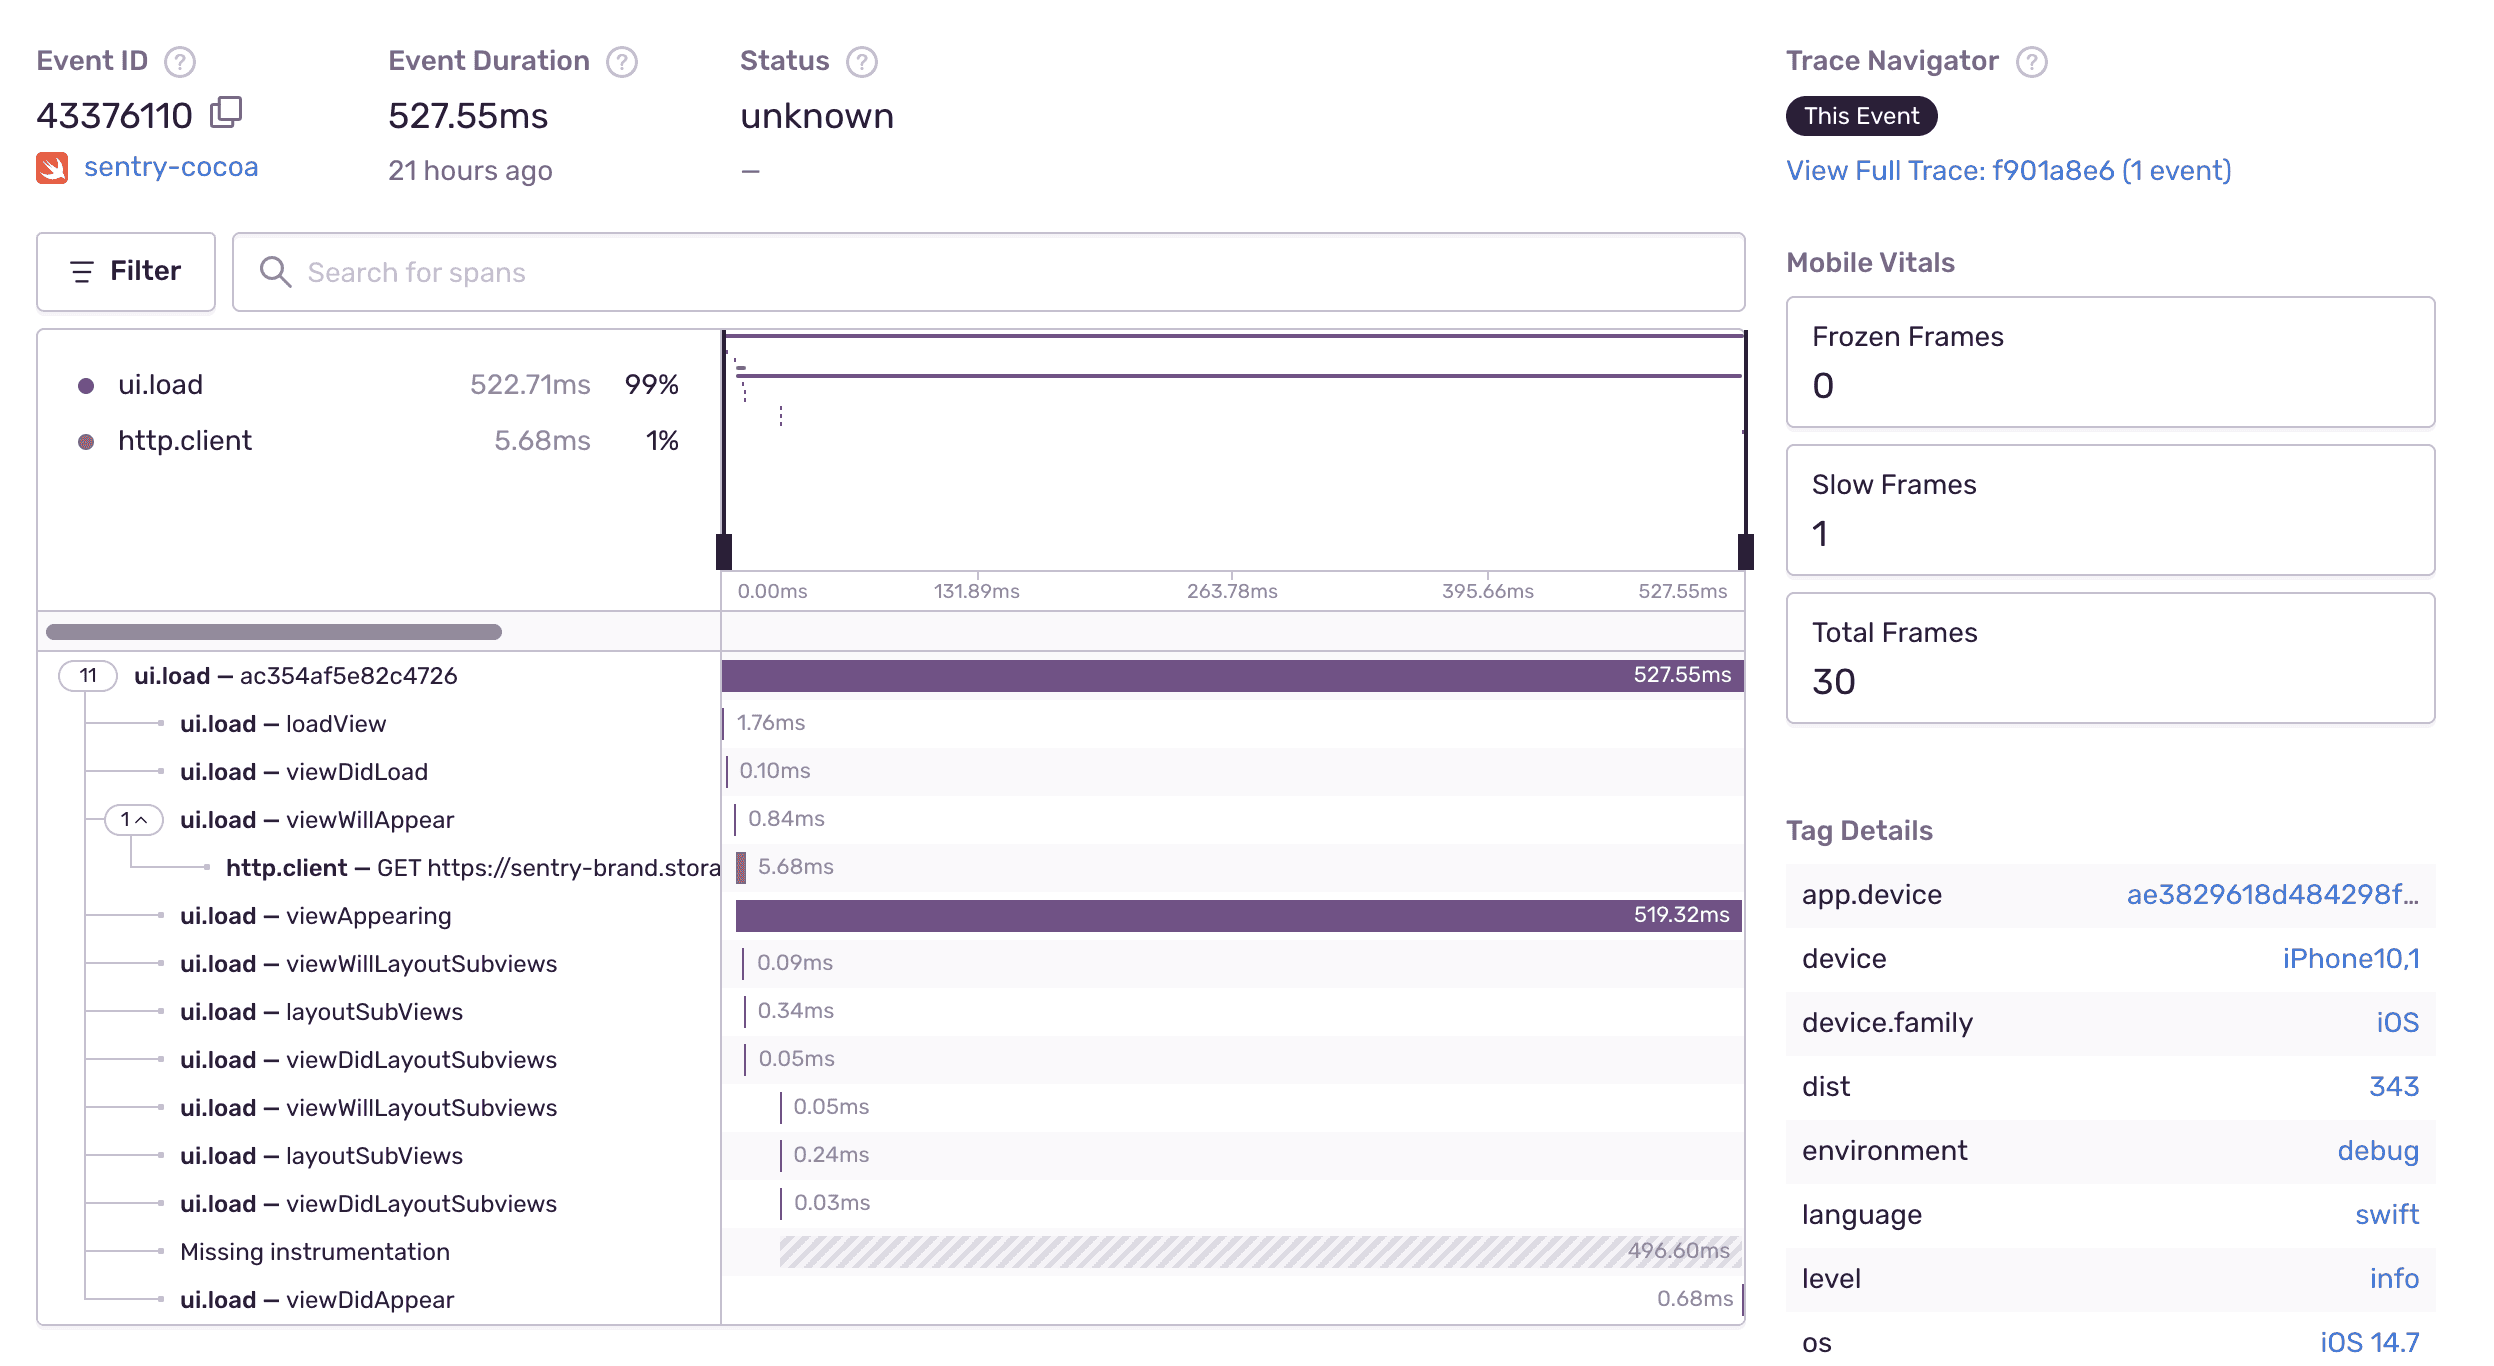
iOS Performance Monitoring
Quickly identify performance issues and view the full end-to-end distributed trace to see the exact poor-performing API call and what caused it. Measure everything from warm starts to froze frames so you can improve iOS performance with max efficiency, not max effort.
iOS Continuous Profiling
Get code-level insight into how your application performs in production environments on real user devices. Find the root cause of slowdowns and issues consuming the most resources, like CPU or memory, and affecting iOS application performance on your user’s mobile device.
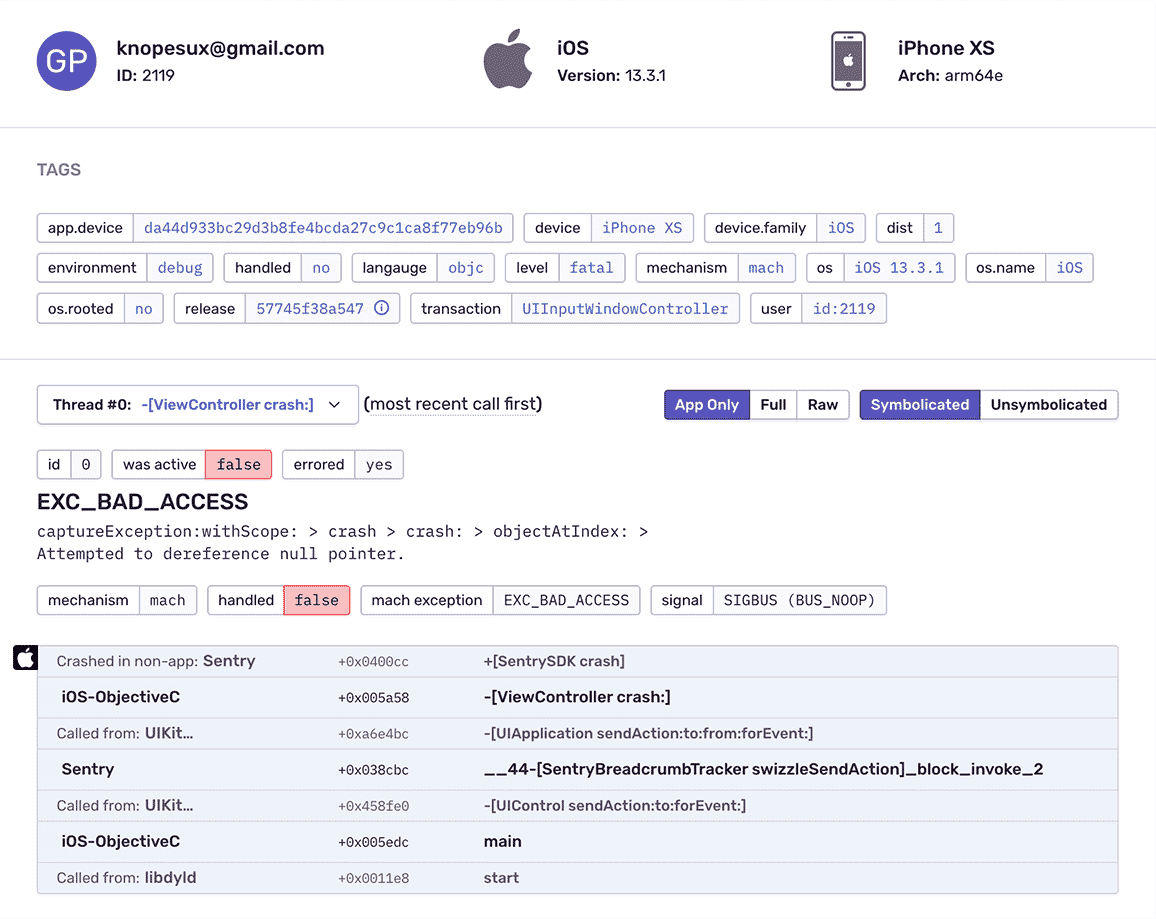
Get iOS Crash Reporting With Complete Stack Traces
Reveal hidden context in Apple’s incomplete crash data by automatically symbolicating unreadable symbols. Handle Cocoa iOS crashes with complete context using the React Native SDK while the Objective-C SDK runs in the background.
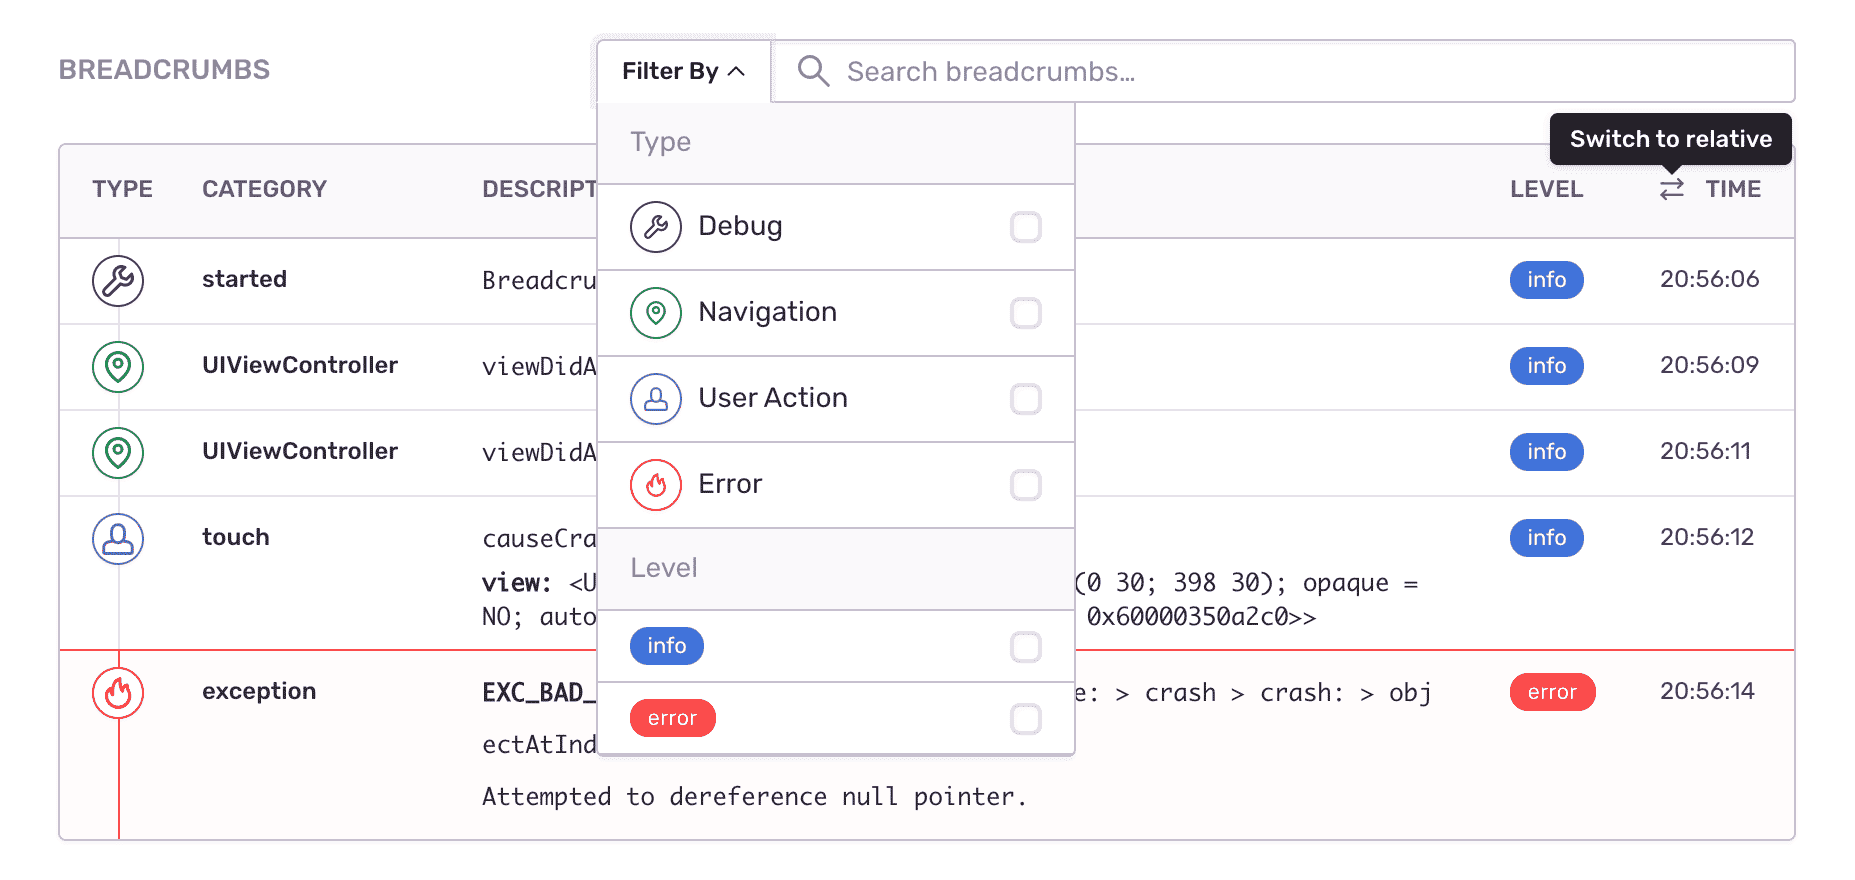
Fill In The Blanks About iOS Crashes
See what the app was doing when the iOS crash occurred: every user action, controller changes, and custom breadcrumbs. Record events when devices are offline or in airplane mode, then send crash reports as soons as connection is regained.
Resolve iOS Crashes With Better Data
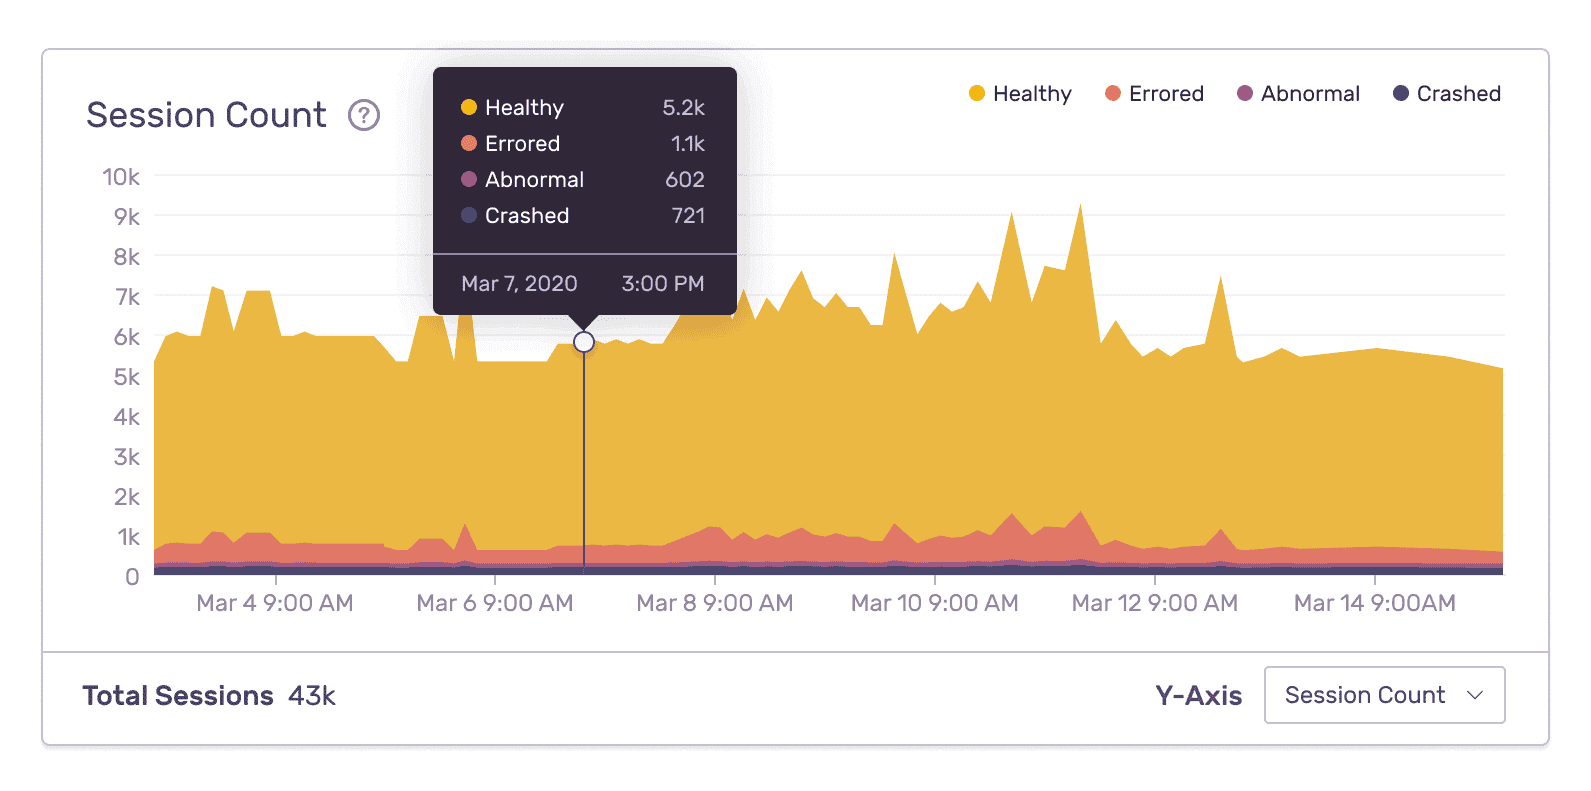
Improve Cocoa error monitoring workflow with a full view of releases so you can mark errors as resolved and prioritize live issues. Learn in which version bug first appeared, merge duplicates, and know if things regress in a future release. Add commit data to automatically suggest an owner of each iOS crash and instantly send deploy emails.
“Being able to use Sentry to monitor the performance as well as our mobile applications is important. Using one solution to monitor the entire application stack gives our engineers the visibility they need to deliver a first-rate experience for our customers.”
See The Full Picture Of Any iOS Exception
See what the app was doing when the iOS crash occurred
Find answers to the key questions and insights need to resolve the issue
How actionable is this crash? What was the device? Has this same crash occurred before?
FAQs
Sentry supports every major language, framework, and library. You can browse each of them here.
You can get started for free. Pricing depends on the number of monthly events, transactions, and attachments that you send Sentry. For more details, visit our pricing page.
Sentry doesn’t impact a web site’s performance.
If you look at the configuration options for when you initialize Sentry in your code, you’ll see there’s nothing regarding minimizing its impact on your app’s performance. This is because our team of SDK engineers already developed Sentry with this in mind.
Sentry is a listener/handler for errors that asynchronously sends out the error/event to Sentry.io. This is non-blocking. The error/event only goes out if this is an error.
Global handlers have almost no impact as well, as they are native APIs provided by the browsers.
Supporting Resources
A better experience for your users. An easier life for your developers.
A peek at your privacy
Here’s a quick look at how Sentry handles your personal information (PII).
×Who we collect PII from
We collect PII about people browsing our website, users of the Sentry service, prospective customers, and people who otherwise interact with us.
What if my PII is included in data sent to Sentry by a Sentry customer (e.g., someone using Sentry to monitor their app)? In this case you have to contact the Sentry customer (e.g., the maker of the app). We do not control the data that is sent to us through the Sentry service for the purposes of application monitoring.
Am I included?PII we may collect about you
- PII provided by you and related to your
- Account, profile, and login
- Requests and inquiries
- Purchases
- PII collected from your device and usage
- PII collected from third parties (e.g., social media)
How we use your PII
- To operate our site and service
- To protect and improve our site and service
- To provide customer care and support
- To communicate with you
- For other purposes (that we inform you of at collection)
Third parties who receive your PII
We may disclose your PII to the following type of recipients:
- Subsidiaries and other affiliates
- Service providers
- Partners (go-to-market, analytics)
- Third-party platforms (when you connect them to our service)
- Governmental authorities (where necessary)
- An actual or potential buyer
We use cookies (but not for advertising)
- We do not use advertising or targeting cookies
- We use necessary cookies to run and improve our site and service
- You can disable cookies but this can impact your use or access to certain parts of our site and service
Know your rights
You may have the following rights related to your PII:
- Access, correct, and update
- Object to or restrict processing
- Port over
- Opt-out of marketing
- Be forgotten by Sentry
- Withdraw your consent
- Complain about us
If you have any questions or concerns about your privacy at Sentry, please email us at compliance@sentry.io.
If you are a California resident, see our Supplemental notice.