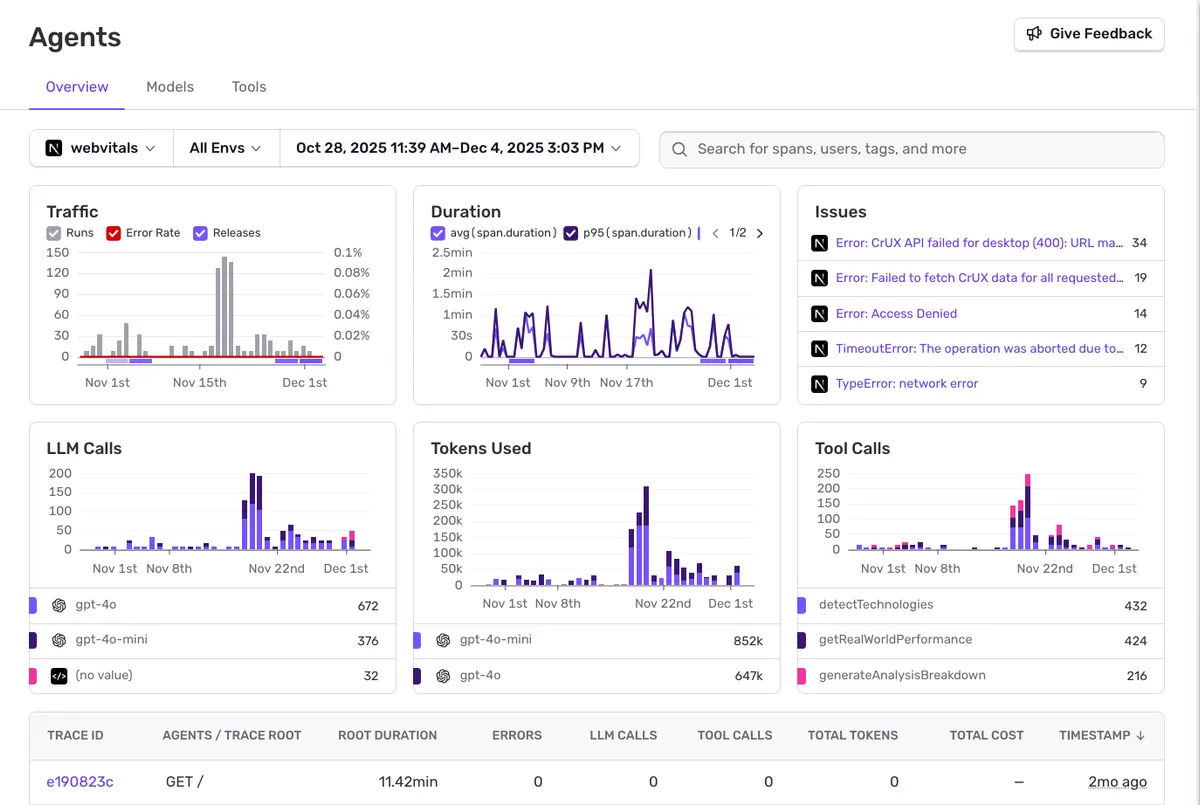
Track all agent runs, error rates, LLM calls, tokens used, and tool executions. Monitor traffic patterns and duration metrics across your AI-powered features.
AI and LLM Observability
Agents, LLMs, vector stores, custom logic—visibility can’t stop at the model call.
Get the context you need to debug failures, optimize performance, and keep AI features reliable.
Tolerated by 4 million developers
- Anthropic
- Cursor
- GitHub
- Vercel
- Microsoft
- Bolt
- Factory AI
- Cognition
- Pinecone
- ElevenLabs
- Glean
- Harvey
- Mistral
- Replit
Full LLM Observability

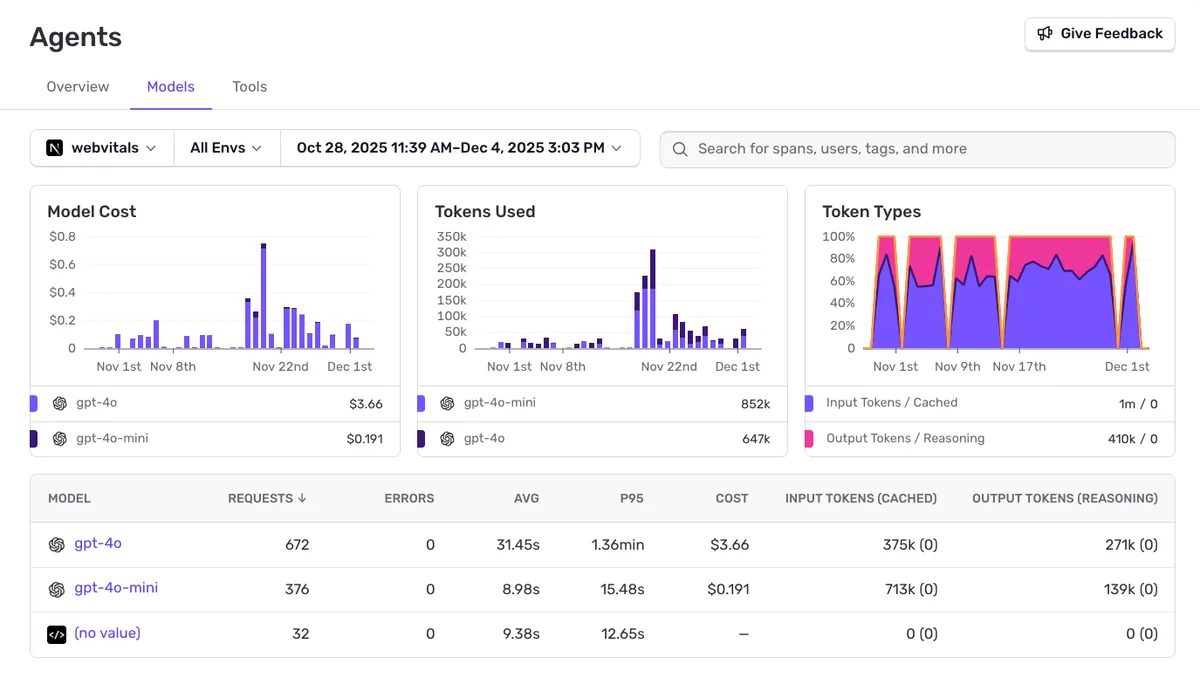
Track Model Costs & Tokens

Monitor spending across models.
Compare costs across different models. See token usage breakdown by model, track input vs output tokens, and identify expensive operations.
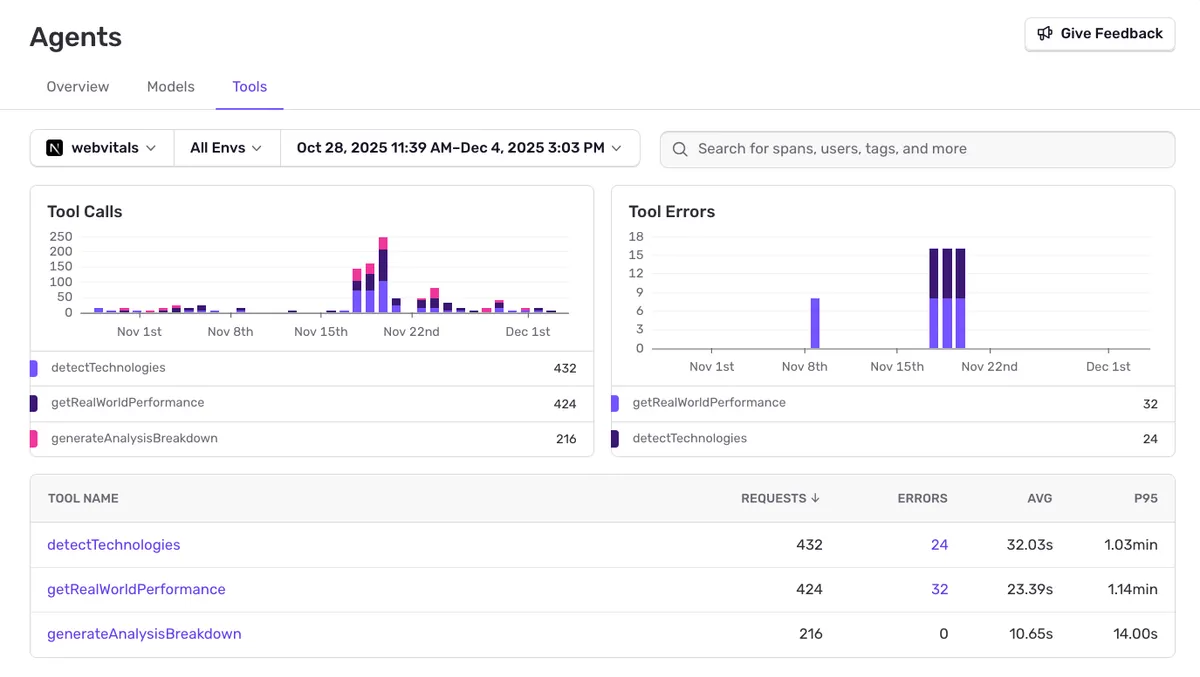
Monitor tool execution
Track agent tool calls and errors.
See which tools your agents call, their error rates, average duration, and P95 latency. Identify slow or failing tool executions before they impact users.

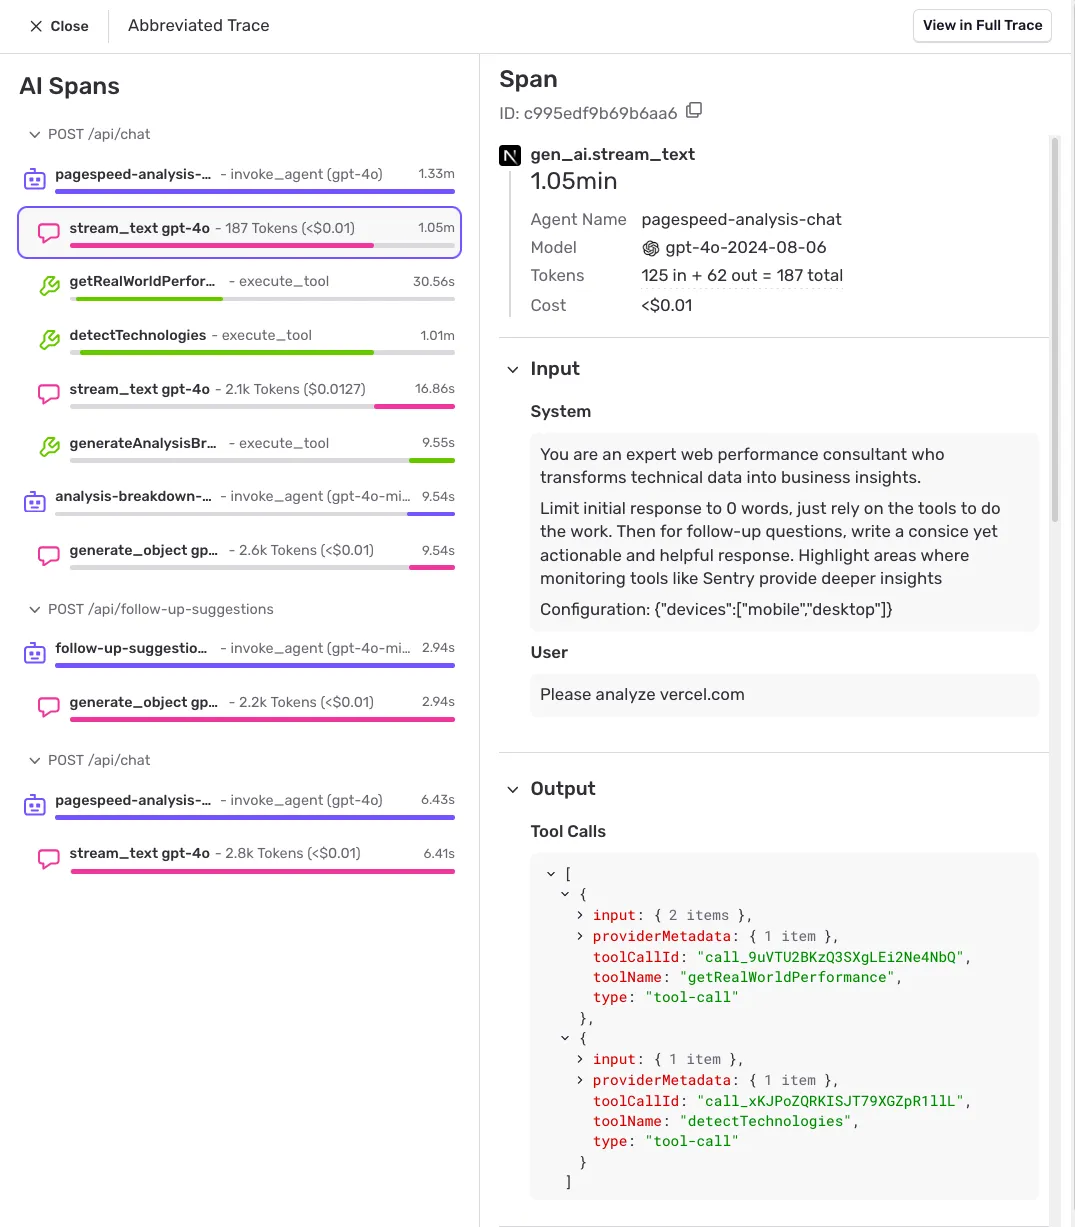
Deep Trace Analysis

Debug with full context.
Dive into individual requests with full prompt and response context. See AI spans with agent invocations, tool executions, token counts, costs, and timing.
Getting started with Sentry is simple
We support every technology (except the ones we don't).
Get started with just a few lines of code.
Install sentry-sdk from PyPI:
pip install "sentry-sdk"Add OpenAIAgentsIntegration() to your integrations list:
import sentry_sdk
from sentry_sdk.integrations.openai_agents import OpenAIAgentsIntegration

sentry_sdk.init(
    # Configure your DSN
    dsn="https://examplePublicKey@o0.ingest.sentry.io/0",
    # Add data like inputs and responses to/from LLMs and tools;
    # see https://docs.sentry.io/platforms/python/data-management/data-collected/ for more info
    send_default_pii=True,
    integrations=[
        OpenAIAgentsIntegration(),
    ],
)
The vercelAIIntegration adds instrumentation for the ai SDK by Vercel to capture spans using the AI SDK's built-in Telemetry. Get started with the following snippet:
Sentry.init({
  // Configure your DSN
  dsn: 'https://<key>@sentry.io/<project>',
  tracesSampleRate: 1.0,
  integrations: [
    Sentry.vercelAIIntegration({
      recordInputs: true,
      recordOutputs: true,
    }),
  ],
});
To correctly capture spans, pass the experimental_telemetry object with isEnabled: true to every generateText, generateObject, and streamText function call.
const result = await generateText({
  model: openai("gpt-4o"),
  experimental_telemetry: {
    isEnabled: true,
  },
});
increase in developer productivity
engineers rely on Sentry to ship code
faster incident resolution
Fix what's broken with LLM Observability
Get started with the only LLM observability platform that gives developers tools to fix application problems without compromising on velocity.