Perl Error Monitoring
Debug Perl apps and prevent crashes across your entire stack with Sentry. Resolve issues with a Perl monitoring workflow that actually improves the debugging process.
Perl Monitoring With Complete Stack Traces
More Than Just Bug Tracking
Insights Delivered
"Sentry has become mission-critical to the way we build and ship software."
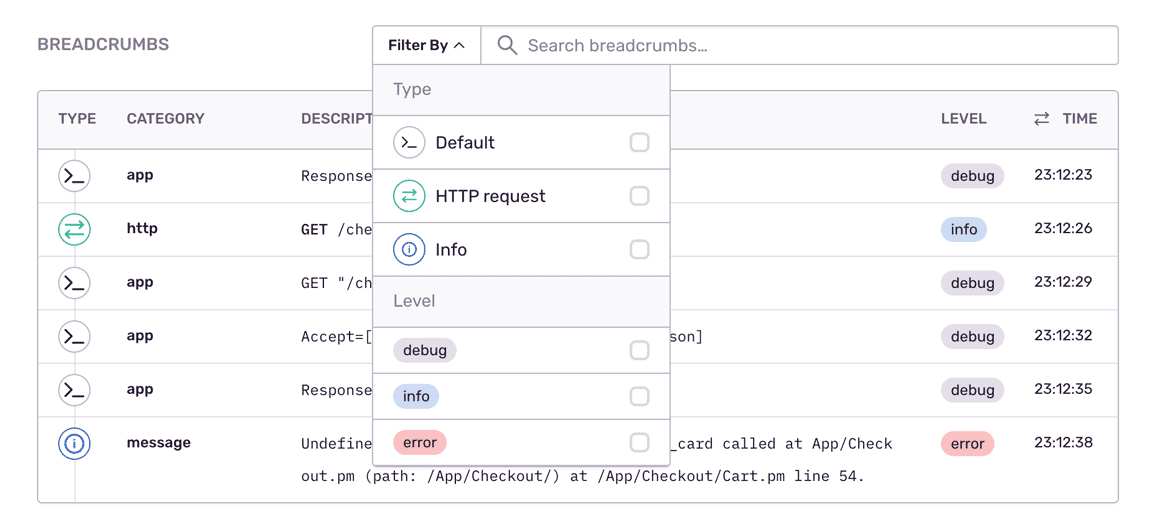
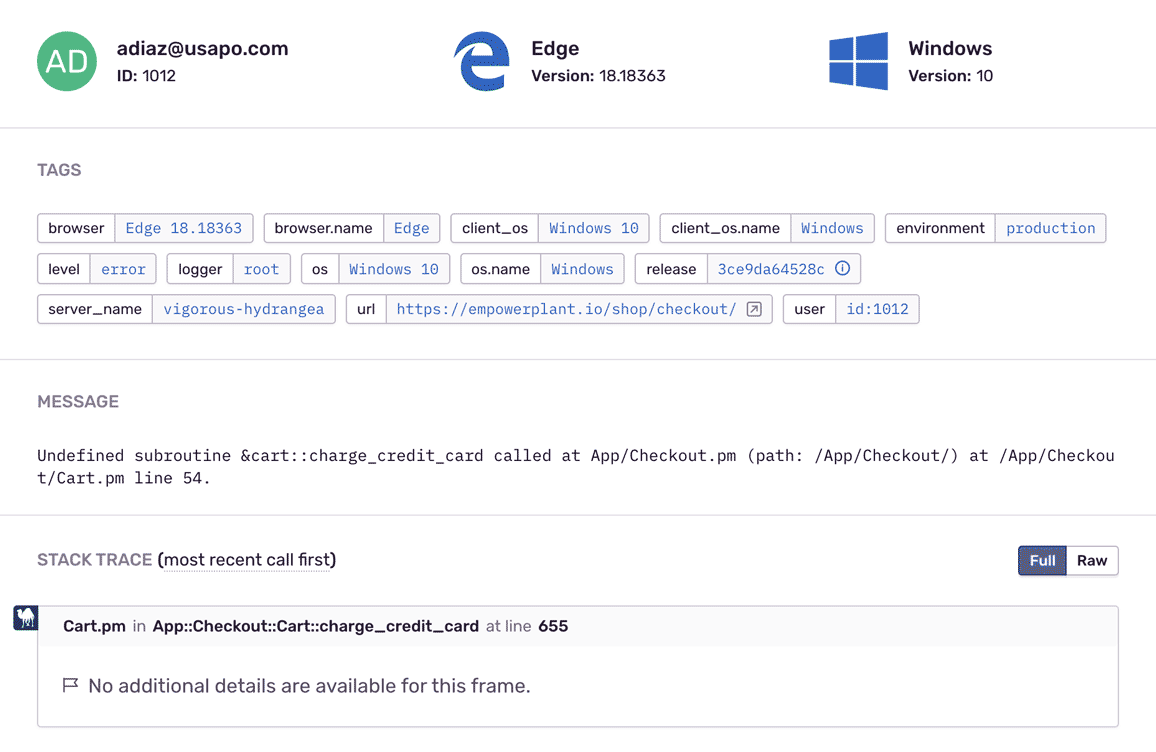
See The Full Picture Of Any Perl Exception
Understand the context that contributed to errors with tags and relevant information about your software, environment, and users.
You can also submit optional custom data to provide extra context for bug tracking that is unique to your application and business.
Find answers to the key questions: Which users are experiencing this bug? What was the value of their shopping cart?
It's why companies that don't have a complete view of their infrastructure are being punished:
The average cost of network downtime is around $5,600 per minute — or $300,000 per hour.
1 out of 5 online shoppers will abandon their cart because the transaction process was too slow.
On average, a two-second slowdown in page load decreases revenues by 4.3 percent.
FAQs
Sentry supports every major language, framework, and library. You can browse each of them here.
You can get started for free. Pricing depends on the number of monthly events, transactions, and attachments that you send Sentry. For more details, visit our pricing page.
Sentry doesn't impact a web site's performance.
If you look at the configuration options for when you initialize Sentry in your code, you'll see there's nothing regarding minimizing its impact on your app's performance. This is because our team of SDK engineers already developed Sentry with this in mind.
Sentry is a listener/handler for errors that asynchronously sends out the error/event to Sentry.io. This is non-blocking. The error/event only goes out if this is an error.
Global handlers have almost no impact as well, as they are native APIs provided by the browsers.