
Symfony Application Monitoring & Error Tracking
Actionable insights to resolve Symfony performance bottlenecks and errors. Improve your monitoring workflow with a full view of releases so you can mark Symfony errors as resolved and prioritize live issues.
More than 150K Organizations Trust Sentry with Their Application Monitoring
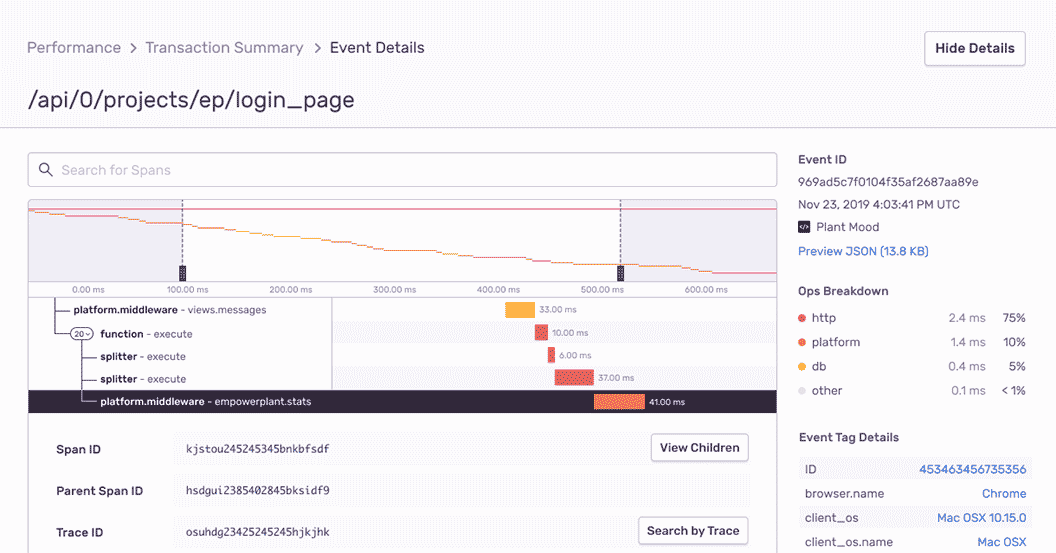
Symfony Performance Monitoring
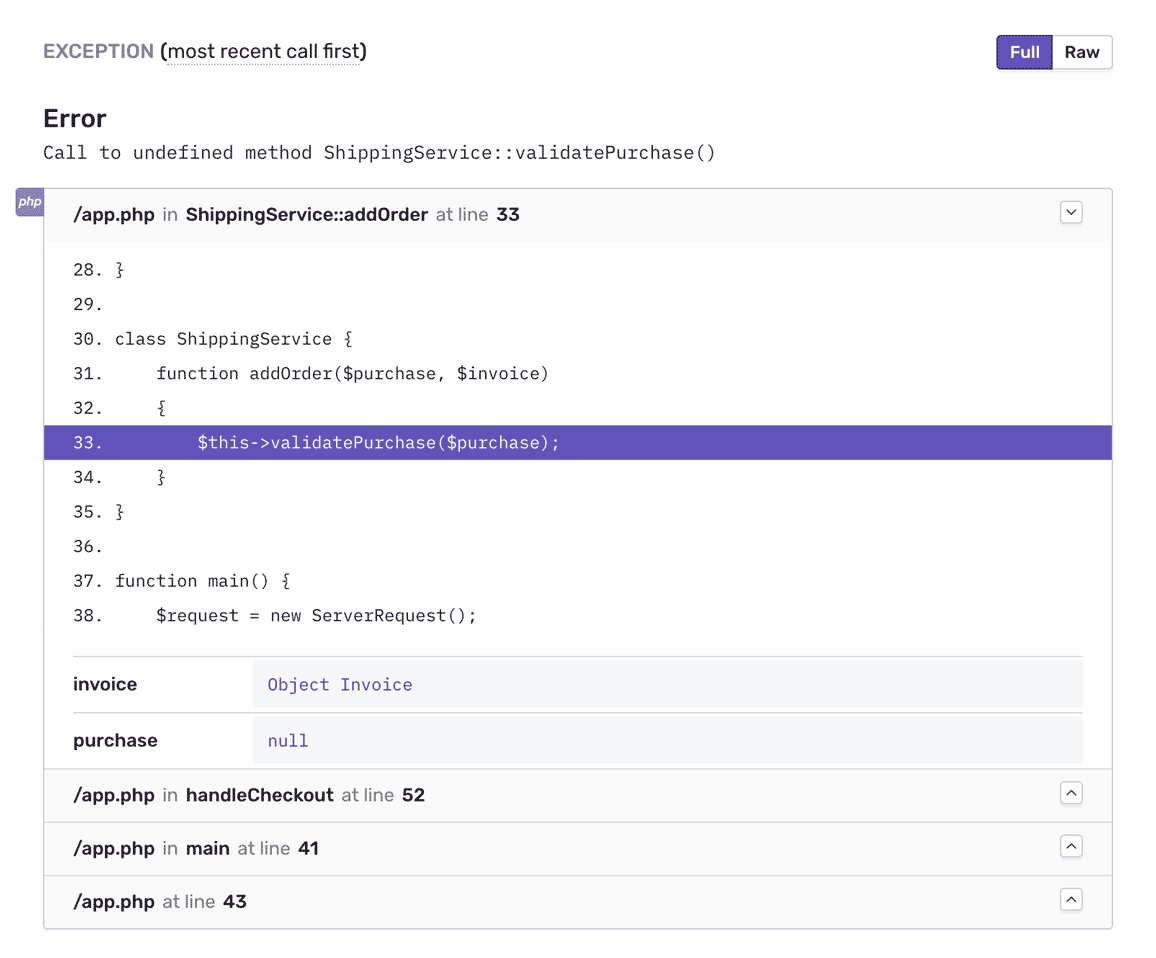
Symfony Error Monitoring with Complete Stack Traces
Fill In the Blanks About Symfony Errors

Set up Sentry through Forge
"Sentry gives us a good overview of any possible issues that were caused by a release, and the ability to fix them before they become real problems."
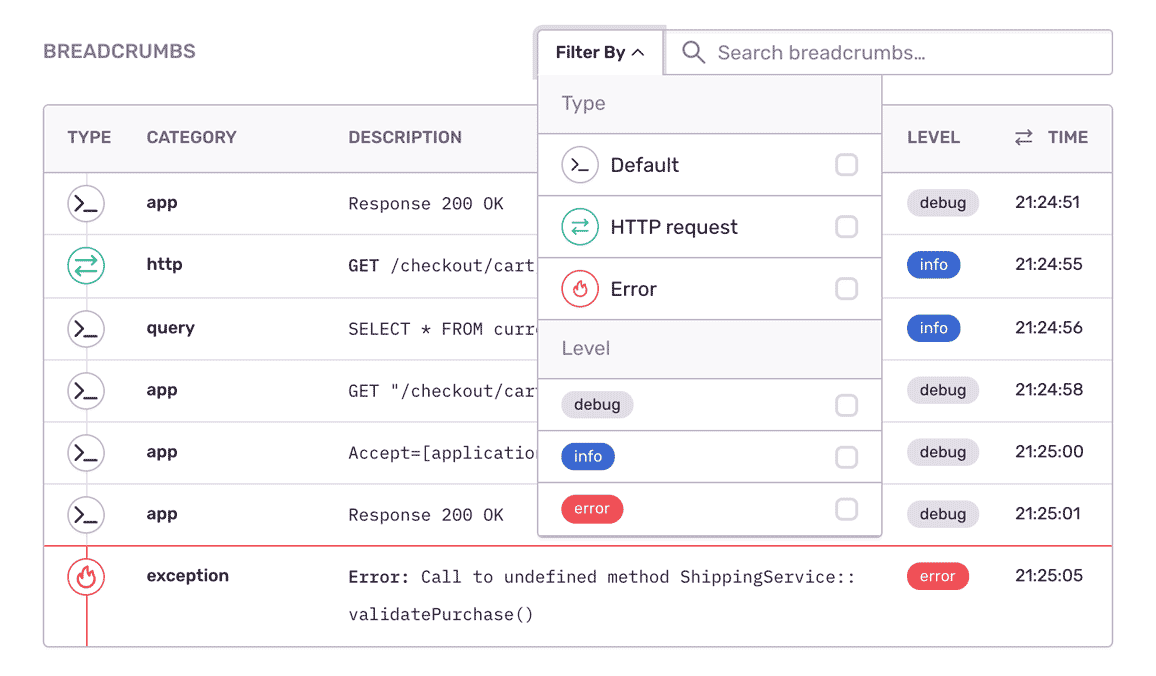
See the Full Picture of Any Symfony Exception
Aggregate errors by factors like request details, user ID, and app version to see what's new, a priority, or a trend.
Assign custom key-value tags to reproduce the error environment specific to your application, business, and users.
Find answers to key questions: Was it a code error or usage exception? In which app release did the Symfony bug occur?
FAQs
Yes, please see our docs for more details.
Profiling for PHP is supported with Sentry Laravel SDK version 3.3.0 and above. Please see the docs for more details.
The Laravel SDK automatically instruments your application to capture transactions and adds spans for the following features:
- Views
- Queue jobs
- Caches
- Notifications
- Database queries
- Redis operations
- Laravel HTTP Client requests
- GraphQL operations (when using Lighthouse)
- Folio page based routes
- Livewire components
Please see our Laravel SDK documentation for more details.
Sentry's Laravel SDK supports PHP 7.2 and up.
Sentry supports 8.x, 9.x and 10.x as well as Laravel Lumen 8.x, 9.x and 10.x. Older versions of the SDK support Laravel from version 4.x.
Please see our Laravel SDK docs for more information.
Yes, Sentry supports Scheduled Tasks monitoring in Laravel with Sentry Crons.
Sentry supports every major frontend language, framework, and library. You can browse each of them here.
You can get started for free. Pricing depends on the number of monthly events, transactions, and attachments that you send Sentry. For more details, visit our pricing page.
Sentry doesn't impact a web site's performance.
If you look at the configuration options for when you initialize Sentry in your code, you'll see there's nothing regarding minimizing its impact on your app's performance. This is because our team of SDK engineers already developed Sentry with this in mind.
Sentry is a listener/handler for errors that asynchronously sends out the error/event to Sentry.io. This is non-blocking. The error/event only goes out if this is an error.
Global handlers have almost no impact as well, as they are native APIs provided by the browsers.