tvOS Error Tracking & Performance Monitoring

Actionable insights to resolve tvOS performance bottlenecks and errors. Improve your monitoring workflow with a full view of releases so you can mark tvOS errors as resolved and prioritize live issues.
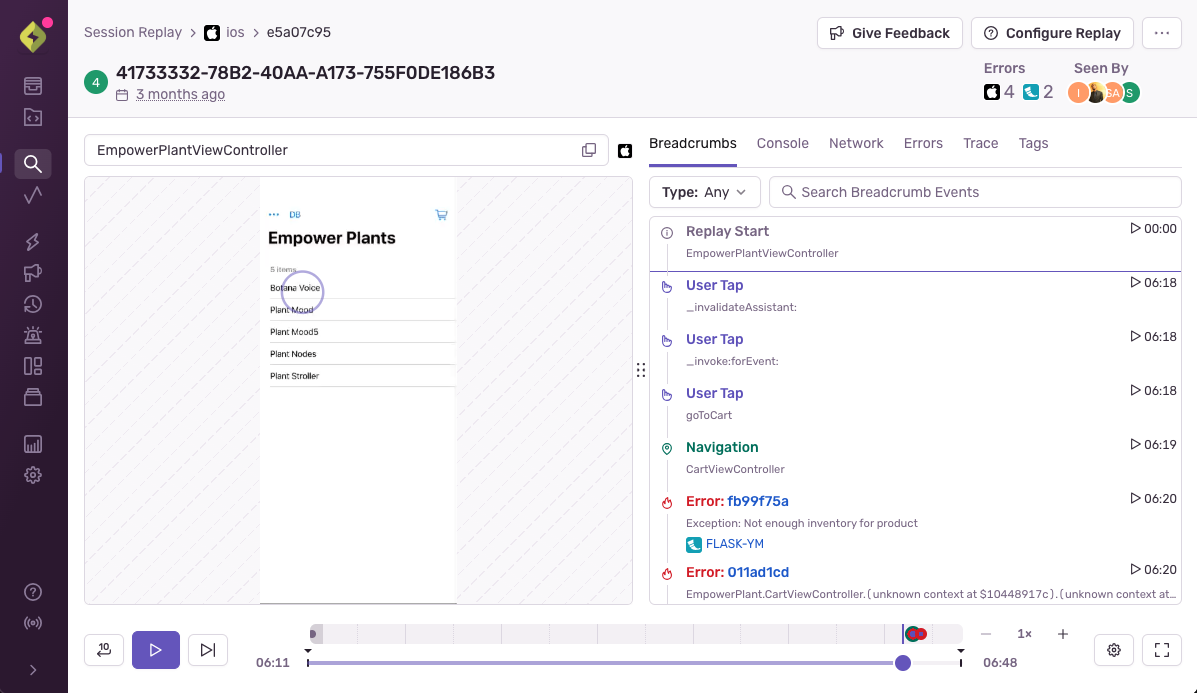
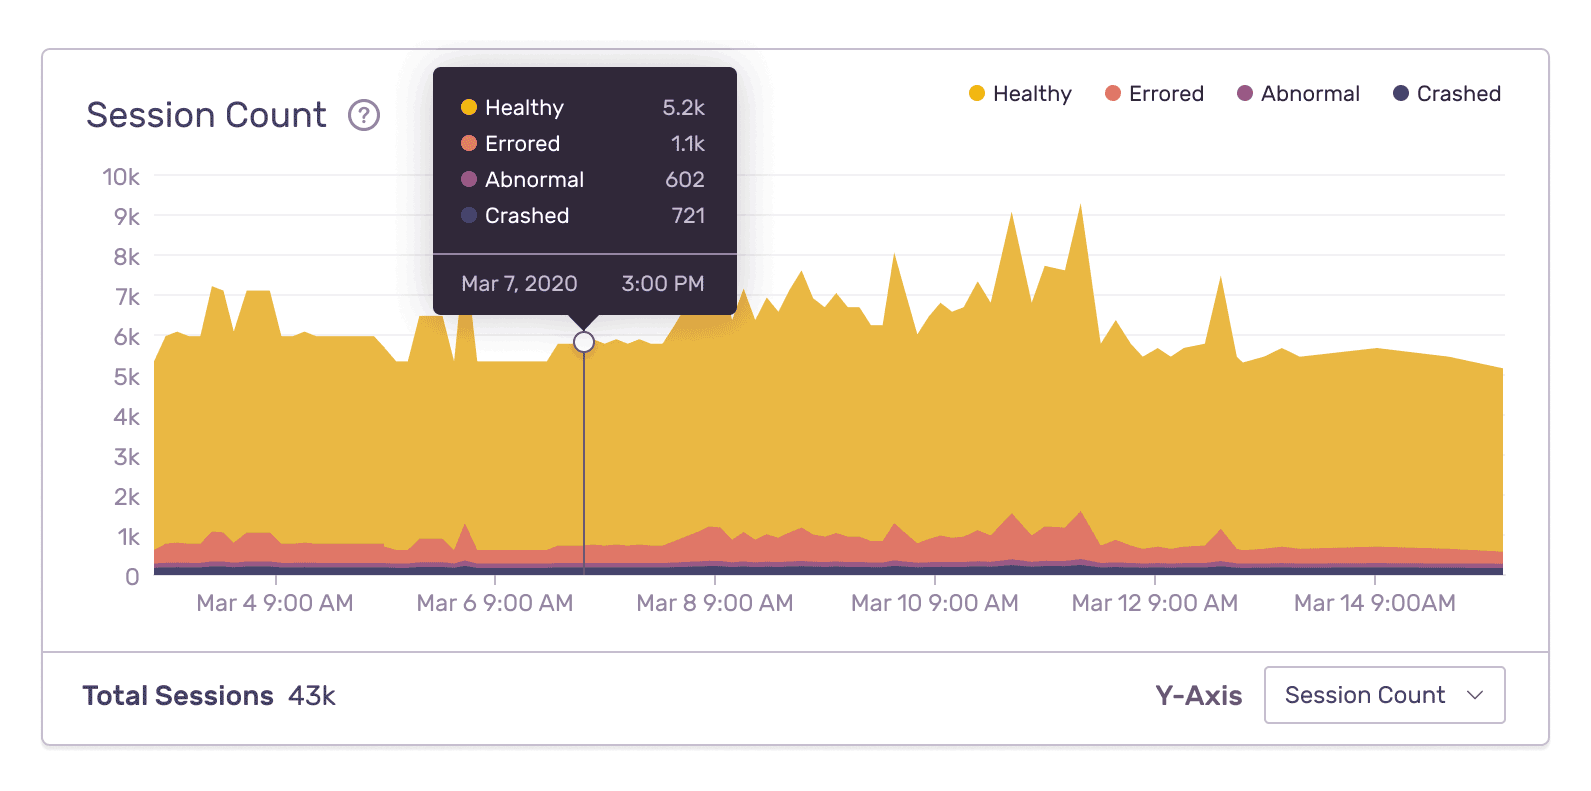
Getting Started is Simple

To integrate Sentry into your Xcode project, specify it in your Podfile, then run pod install:

Copied!Click to Copy
platform :tvos, '9.0'
use_frameworks! # This is important

target 'YourApp' do
  pod 'Sentry', :git => 'https://github.com/getsentry/sentry-cocoa.git', :tag => '9.9.0'
end

Initialize the SDK as soon as possible in your application lifecycle:

Copied!Click to Copy
import Sentry

SentrySDK.start { options in
    options.dsn = "https://<key>@sentry.io/<project>"
    options.debug = true
    options.tracesSampleRate = 1.0
}

To integrate Sentry into your Xcode project, specify it in your Podfile, then run pod install:

Copied!Click to Copy
platform :tvos, '9.0'
use_frameworks! # This is important

target 'YourApp' do
  pod 'Sentry', :git => 'https://github.com/getsentry/sentry-cocoa.git', :tag => '9.9.0'
end

Initialize the SDK as soon as possible in your application lifecycle:

Copied!Click to Copy
@import Sentry;

- (BOOL)application:(UIApplication *)application didFinishLaunchingWithOptions:(NSDictionary *)launchOptions {

    [SentrySDK startWithConfigureOptions:^(SentryOptions *options) {
        options.dsn = @"https://<key>@sentry.io/<project>";
        options.debug = @YES;
        options.tracesSampleRate = @1.0;
    }];

    return YES;
}

Session Replay

Get to the root cause of an issue faster by watching replays of real user sessions with best-in-class privacy controls. Understand when, where, and how an error is impacting your app without having to repro it yourself, talk to a customer, or expose sensitive data.

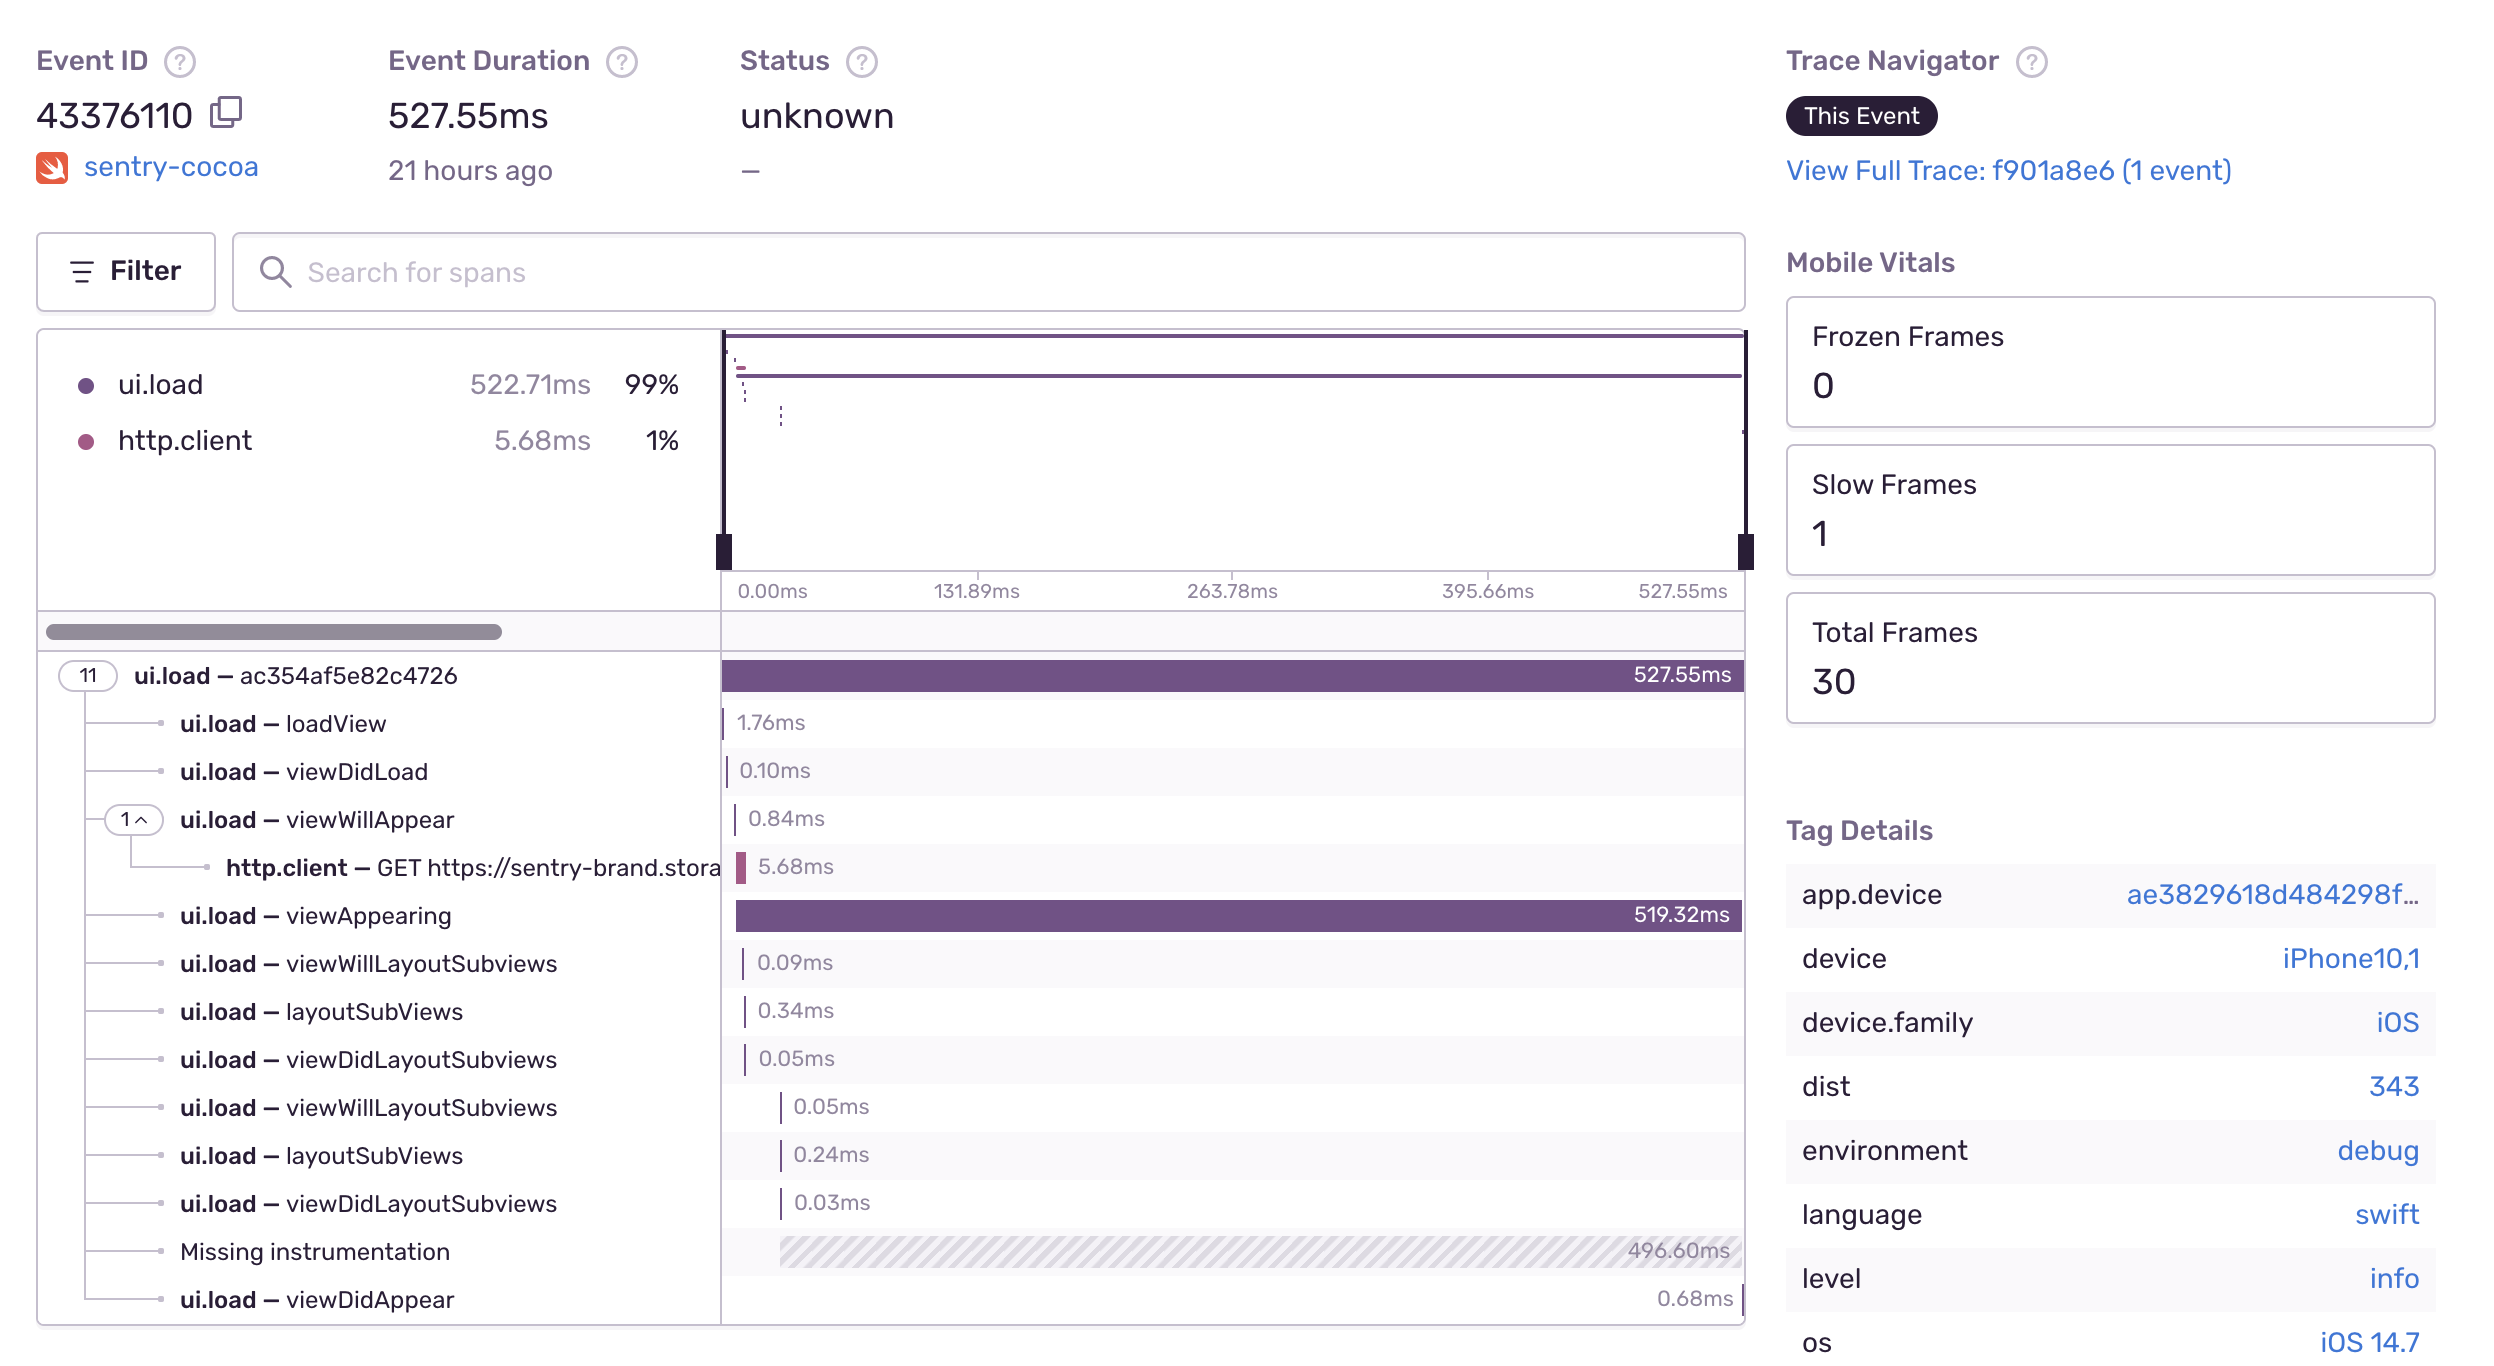
tvOS Performance Monitoring

Quickly identify performance issues and view the full end-to-end distributed trace to see the exact poor-performing API call and what caused it. Measure everything from warm starts to froze frames so you can improve tvOS performance with max efficiency, not max effort.
See a Sample Transaction

tvOS Continuous Profiling

Get code-level insight into how your application performs in production environments on real user devices. Find the root cause of slowdowns and issues consuming the most resources, like CPU or memory, and affecting tvOS application performance on your user's device.

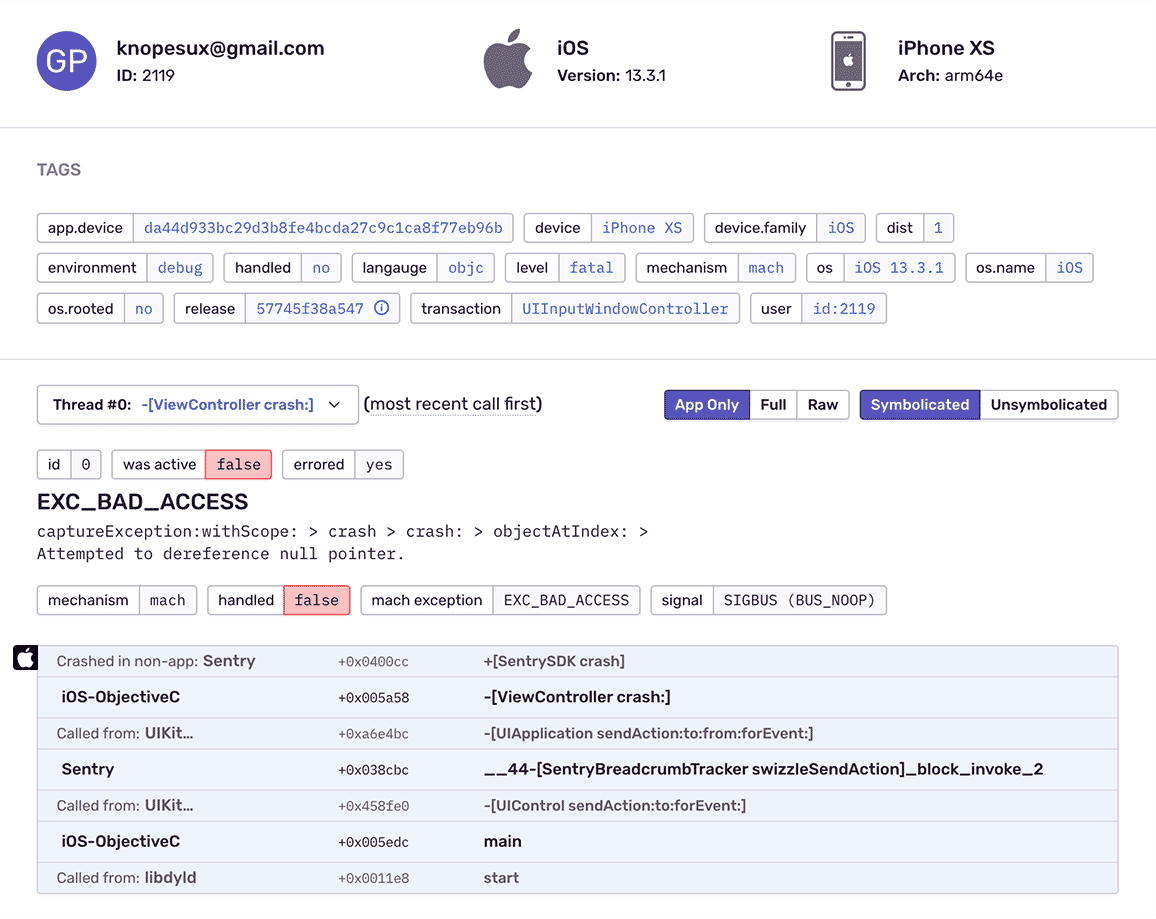
Get tvOS Crash Reporting With Complete Stack Traces

Reveal hidden context in Apple's incomplete crash data by automatically symbolicating unreadable symbols. Handle Cocoa tvOS crashes with complete context using the React Native SDK while the Objective-C SDK runs in the background.
See a Sample Stack Trace

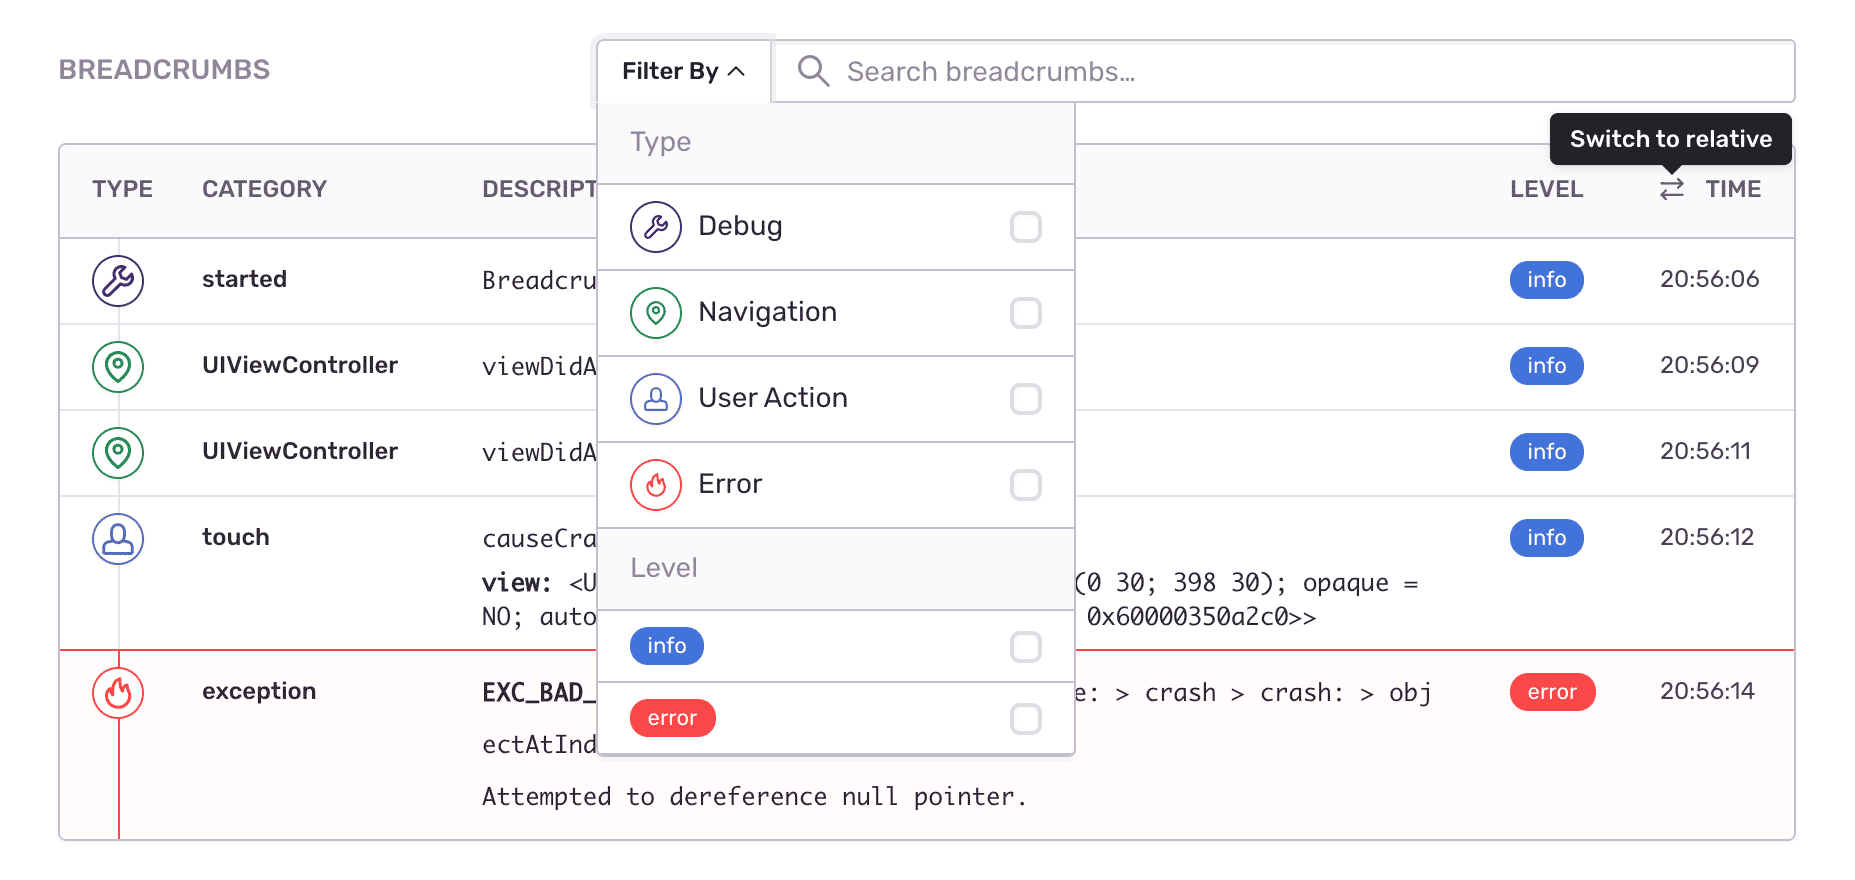
Fill In The Blanks About tvOS Crashes

See what the app was doing when the tvOS crash occurred: every user action, controller changes, and custom breadcrumbs. Record events when devices are offline or in airplane mode, then send crash reports as soons as connection is regained.
Check out Breadcrumbs

Resolve tvOS Crashes With Better Data

Improve Cocoa error monitoring workflow with a full view of releases so you can mark errors as resolved and prioritize live issues. Learn in which version bug first appeared, merge duplicates, and know if things regress in a future release. Add commit data to automatically suggest an owner of each tvOS crash and instantly send deploy emails.

"Being able to use Sentry to monitor the performance as well as our mobile applications is important. Using one solution to monitor the entire application stack gives our engineers the visibility they need to deliver a first-rate experience for our customers."

Karan Gupta
CTO
Shift

See The Full Picture Of Any tvOS Exception

See what the app was doing when the tvOS crash occurred

Find answers to the key questions and insights need to resolve the issue

How actionable is this crash? What was the device? Has this same crash occurred before?

FAQs

Traditional logging provides you with a trail of events. Some of those events are errors, but many times they're simply informational. Sentry is fundamentally different because we focus on exceptions, or in other words, we capture application crashes. We discuss in more detail here and on our blog.

Sentry supports every major language, framework, and library. You can browse each of them here.

You can get started for free. Pricing depends on the number of monthly events, transactions, and attachments that you send Sentry. For more details, visit our pricing page.

Sentry doesn't impact a web site's performance.

If you look at the configuration options for when you initialize Sentry in your code, you'll see there's nothing regarding minimizing its impact on your app's performance. This is because our team of SDK engineers already developed Sentry with this in mind.

Sentry is a listener/handler for errors that asynchronously sends out the error/event to Sentry.io. This is non-blocking. The error/event only goes out if this is an error.

Global handlers have almost no impact as well, as they are native APIs provided by the browsers.

A better experience for your users. An easier life for your developers.