Web Vitals Monitoring
Identify UX slowdowns on your webpage with Web Vitals, the Google-defined metrics for page loading, interactivity, and stability. Sentry collects real user data in production so you can pinpoint slow pages and streamline debugging for costly operations.
Web Vitals for Developers
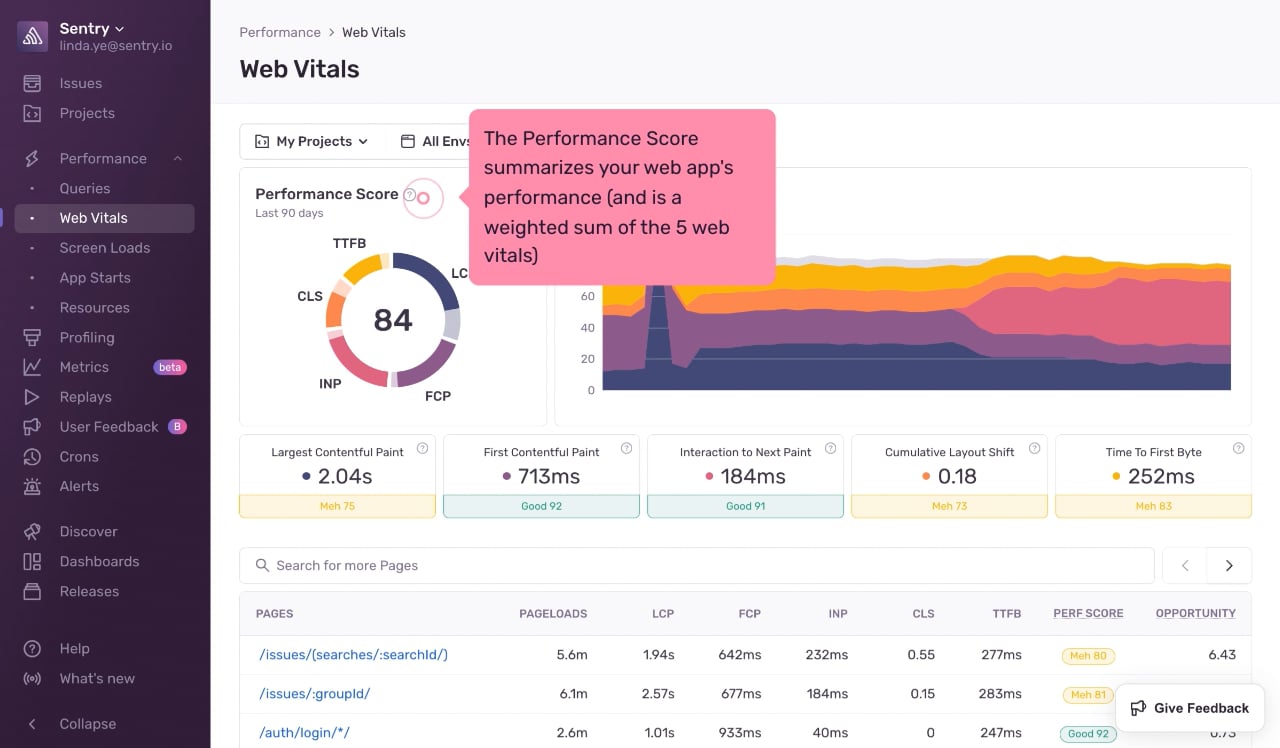
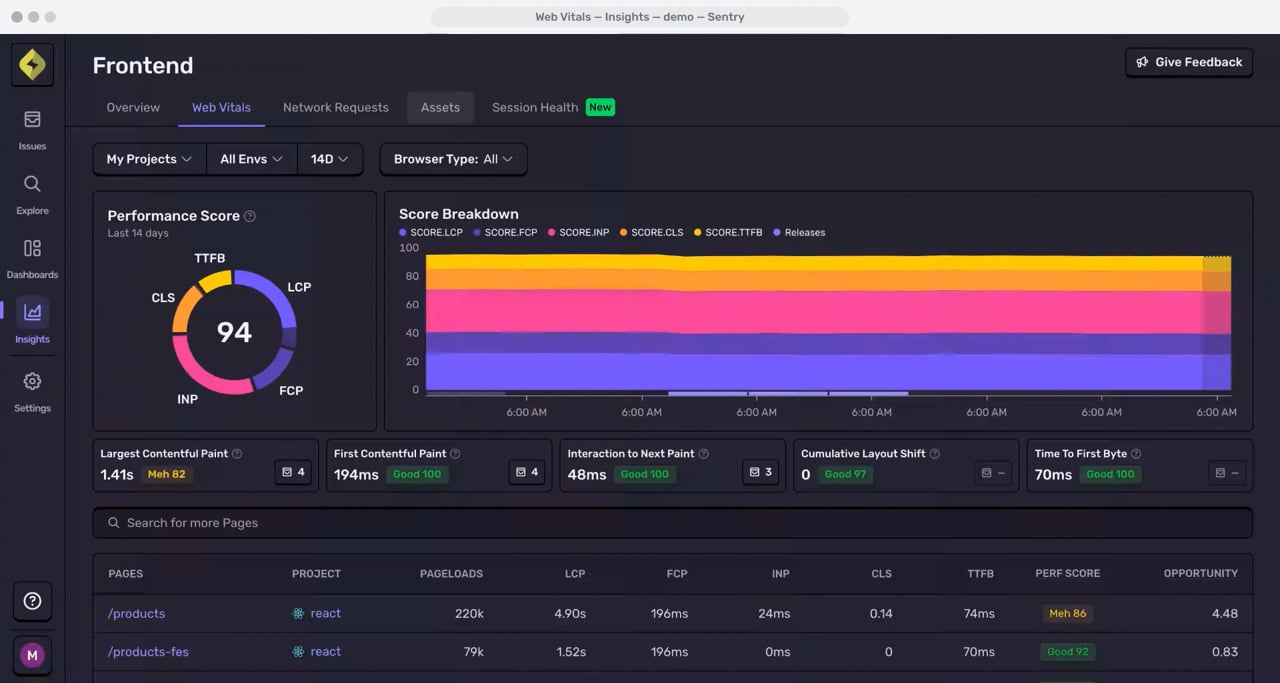
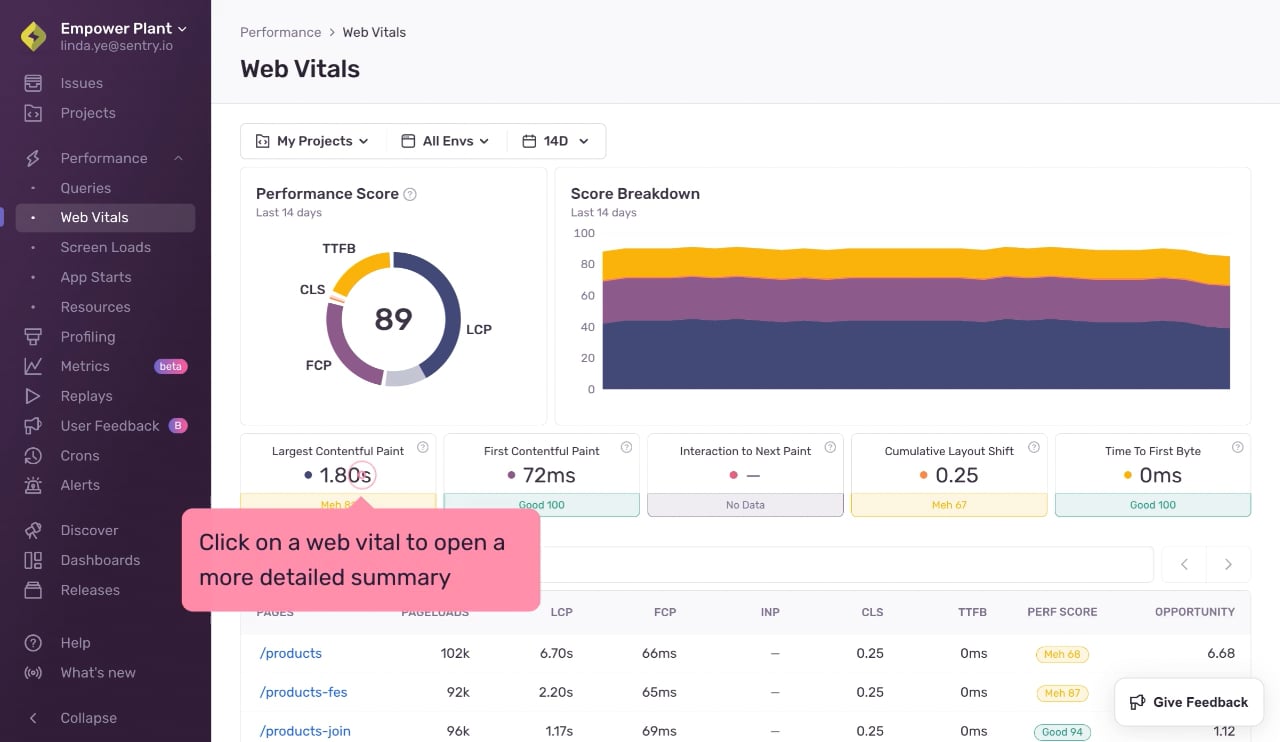
Assess key web vital metrics like LCP, INP, and CLS in a weighted performance score reflecting real user impact. Identify pages most ripe with opportunities to improve the overall performance score.
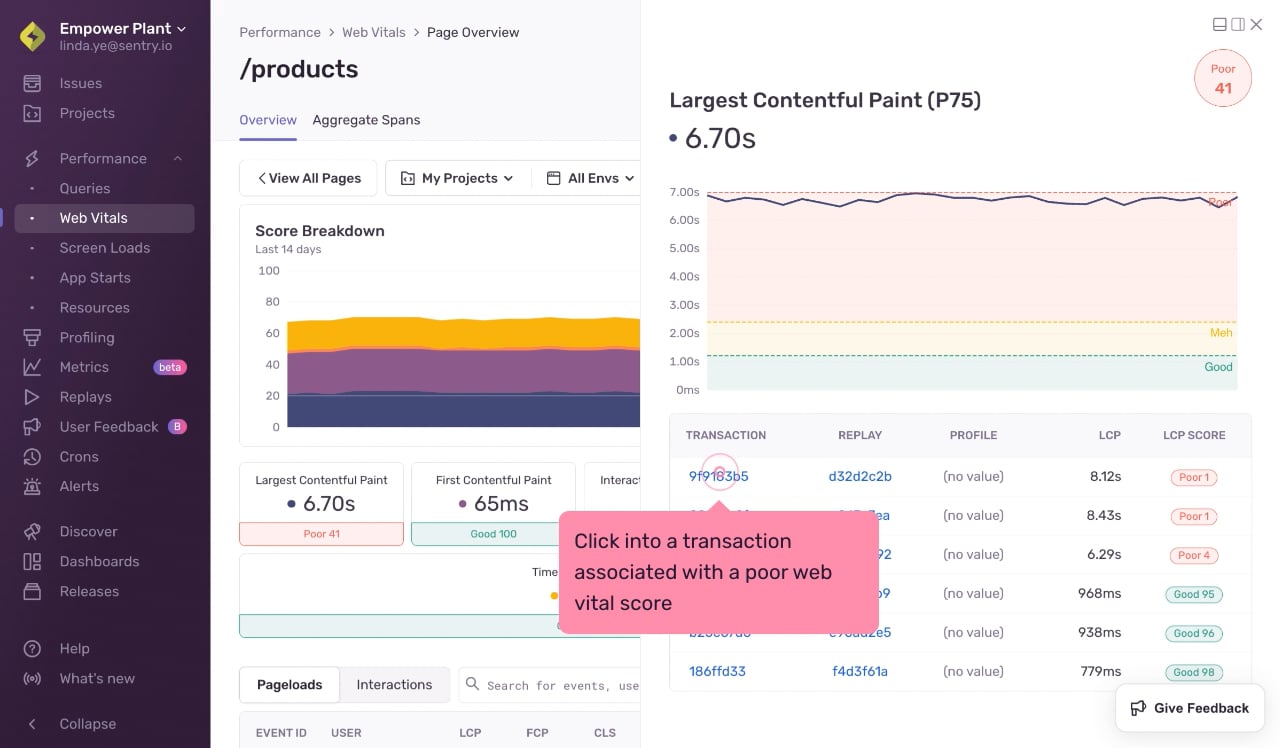
Drill into poor-loading pages with span waterfalls that highlight your most expensive operations. Long task spans can highlight clear performance bottlenecks.
With profiling, find the functions causing your slow page loads. Then use the flame graph context to easily implement a fix in your code.
Getting started with Sentry is simple
We support every technology (except the ones we don't).
Get started with just a few lines of code.
Install
npm install --save @sentry/browserSet Up
import * as Sentry from "@sentry/browser";

Sentry.init({
  dsn: "https://examplePublicKey@o0.ingest.sentry.io/0",
  integrations: [Sentry.browserTracingIntegration()],
  tracesSampleRate: 1.0,
});
Install
npm install --save @sentry/reactSet Up
import * as Sentry from "@sentry/react";

Sentry.init({
  dsn: "https://examplePublicKey@o0.ingest.sentry.io/0",
  integrations: [Sentry.browserTracingIntegration()],
  tracesSampleRate: 1.0,
});
Install
npm install --save @sentry/vueSet Up
import * as Sentry from "@sentry/vue";

Sentry.init({
  dsn: "https://examplePublicKey@o0.ingest.sentry.io/0",
  integrations: [Sentry.browserTracingIntegration()],
  tracesSampleRate: 1.0,
});
Install
ember install @sentry/emberSet Up
import * as Sentry from "@sentry/ember";

Sentry.init({
  dsn: "https://examplePublicKey@o0.ingest.sentry.io/0",
  integrations: [Sentry.browserTracingIntegration()],
  tracesSampleRate: 1.0,
});FAQs
- User Experience: Core Web Vitals directly impact how users perceive your website. Faster load times, quicker interactivity, and stable content ensure a smoother, more enjoyable experience, leading to higher user satisfaction and retention.
- SEO Performance: Google uses Core Web Vitals as ranking factors. Better web vitals can improve your site's search engine ranking, making it more visible and discoverable to users, driving more organic traffic.
- Business impact: Improved web vitals can lead to lower bounce rates, higher engagement, and better conversion rates. This translates to increased user interaction and potential revenue growth.
- Largest Contentful Paint (LCP) - Measures loading performance. Specifically, it marks the time it takes for the largest content element visible in the viewport to be rendered. Good Threshold: LCP should occur within 2.5 seconds of when the page first starts loading.
- Interaction to Next Paint (INP) - A web performance metric that measures how quickly a website responds to user interactions. It assesses a page's responsiveness by observing the latency of all qualifying interactions during a user's visit. INP measures the time between a user's action and the visual update of the page, including interactions such as clicks, taps, key presses, and mouse clicks. Good Threshold: below or at 200 milliseconds.
- Cumulative Layout Shift (CLS) - Measures visual stability. It quantifies how much the page layout shifts during the entire lifespan of the page. Unexpected movement of page content is a poor user experience. Good Threshold: CLS should be less than 0.1.
Core Web Vitals (LCP, FID, CLS) are crucial for SEO as they are part of Google's ranking factors under the Page Experience update. They impact user experience, affecting bounce rates and engagement. Faster load times improve user retention and reduce bounce rates. Quick response times enhance user engagement. Stable layouts prevent user frustration.
Web vitals are calculated by the browser your user is using at the moment a transaction is being recorded, and collected by the SDK in a best-effort manner. Not all browsers provide all web vitals, and you can find our browser support chart here. Each Web Vital is given a rating between 0 to 100 through a Log-Normal Distribution. Learn more about performance scores here.
Of course we have more content


Get monthly product updates from Sentry
Sign up for our newsletter.
And yes, it really is monthly. Ok, maybe the occasional twice a month, but for sure not like one of those daily ones that you just tune out after a while.
Fix it
With Web Vitals, solve the issues impacting your users' experience on their web browser.