Github
 Slack
Slack
We've just given a major update to AI agent monitoring — bringing tracing, tool visibility, model performance, and deep context into one place so you can quickly see what broke, where, and why.
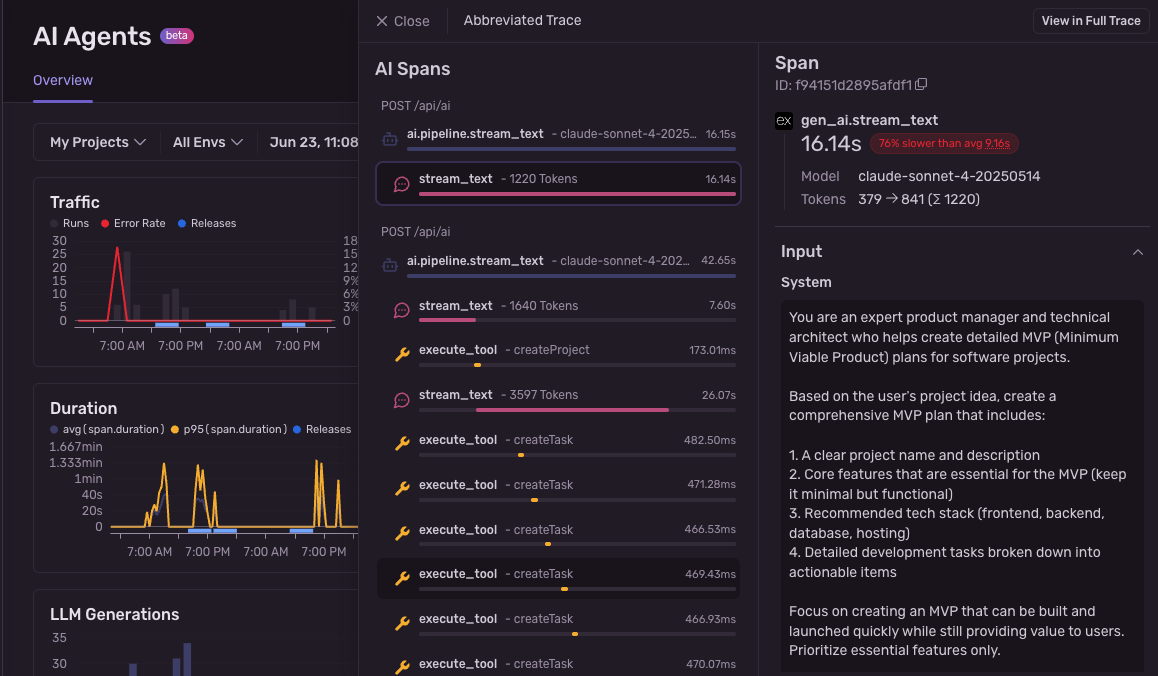
This new release gives you full visibility into every agent run with:
- Execution breakdowns: See system prompts, user input, model calls, tool usage, and final output — step by step.
- Model performance: Track token usage, latency, and error rates, filterable by model and version.
- Tool insights: View usage patterns, durations, and failures to debug slow or broken tool calls.
- Error grouping: Automatically clusters similar failures to cut noise and speed up debugging.
It also includes a new simplified trace view that displays only AI-relevant spans, as well as improvements to the way we display AI span attributes like prompts and tool calls.
With everything tied into tracing, you get a full-stack view of your app — seeing model behavior alongside frontend replays, backend API spans, and release metadata in a single trace.
How to get started
Agent Monitoring is available to all Sentry users. to get started, install or update to the latest SDK version:
- Python SDK >= 2.31.0
- JavaScript SDK >= 9.32.0
And use one of the supported integrations:
- Vercel AI SDK (JS)
- OpenAI Agents SDK (Python)
- Native OpenAI SDK support coming soon.
Read more in our post or head to docs .
Questions? Feedback? Join the conversation in Discord or the discussion in GitHub .