Track what matters. Instrument once. Ask anything.

Track the signals that matter, slice by any attribute at query time, and jump straight to the trace when something spikes — without getting penalized for adding context.

Application Metrics dashboard in Sentry showing checkout latency p99 with breakdown by device model, OS, and release

Every metric, linked to the trace it came from

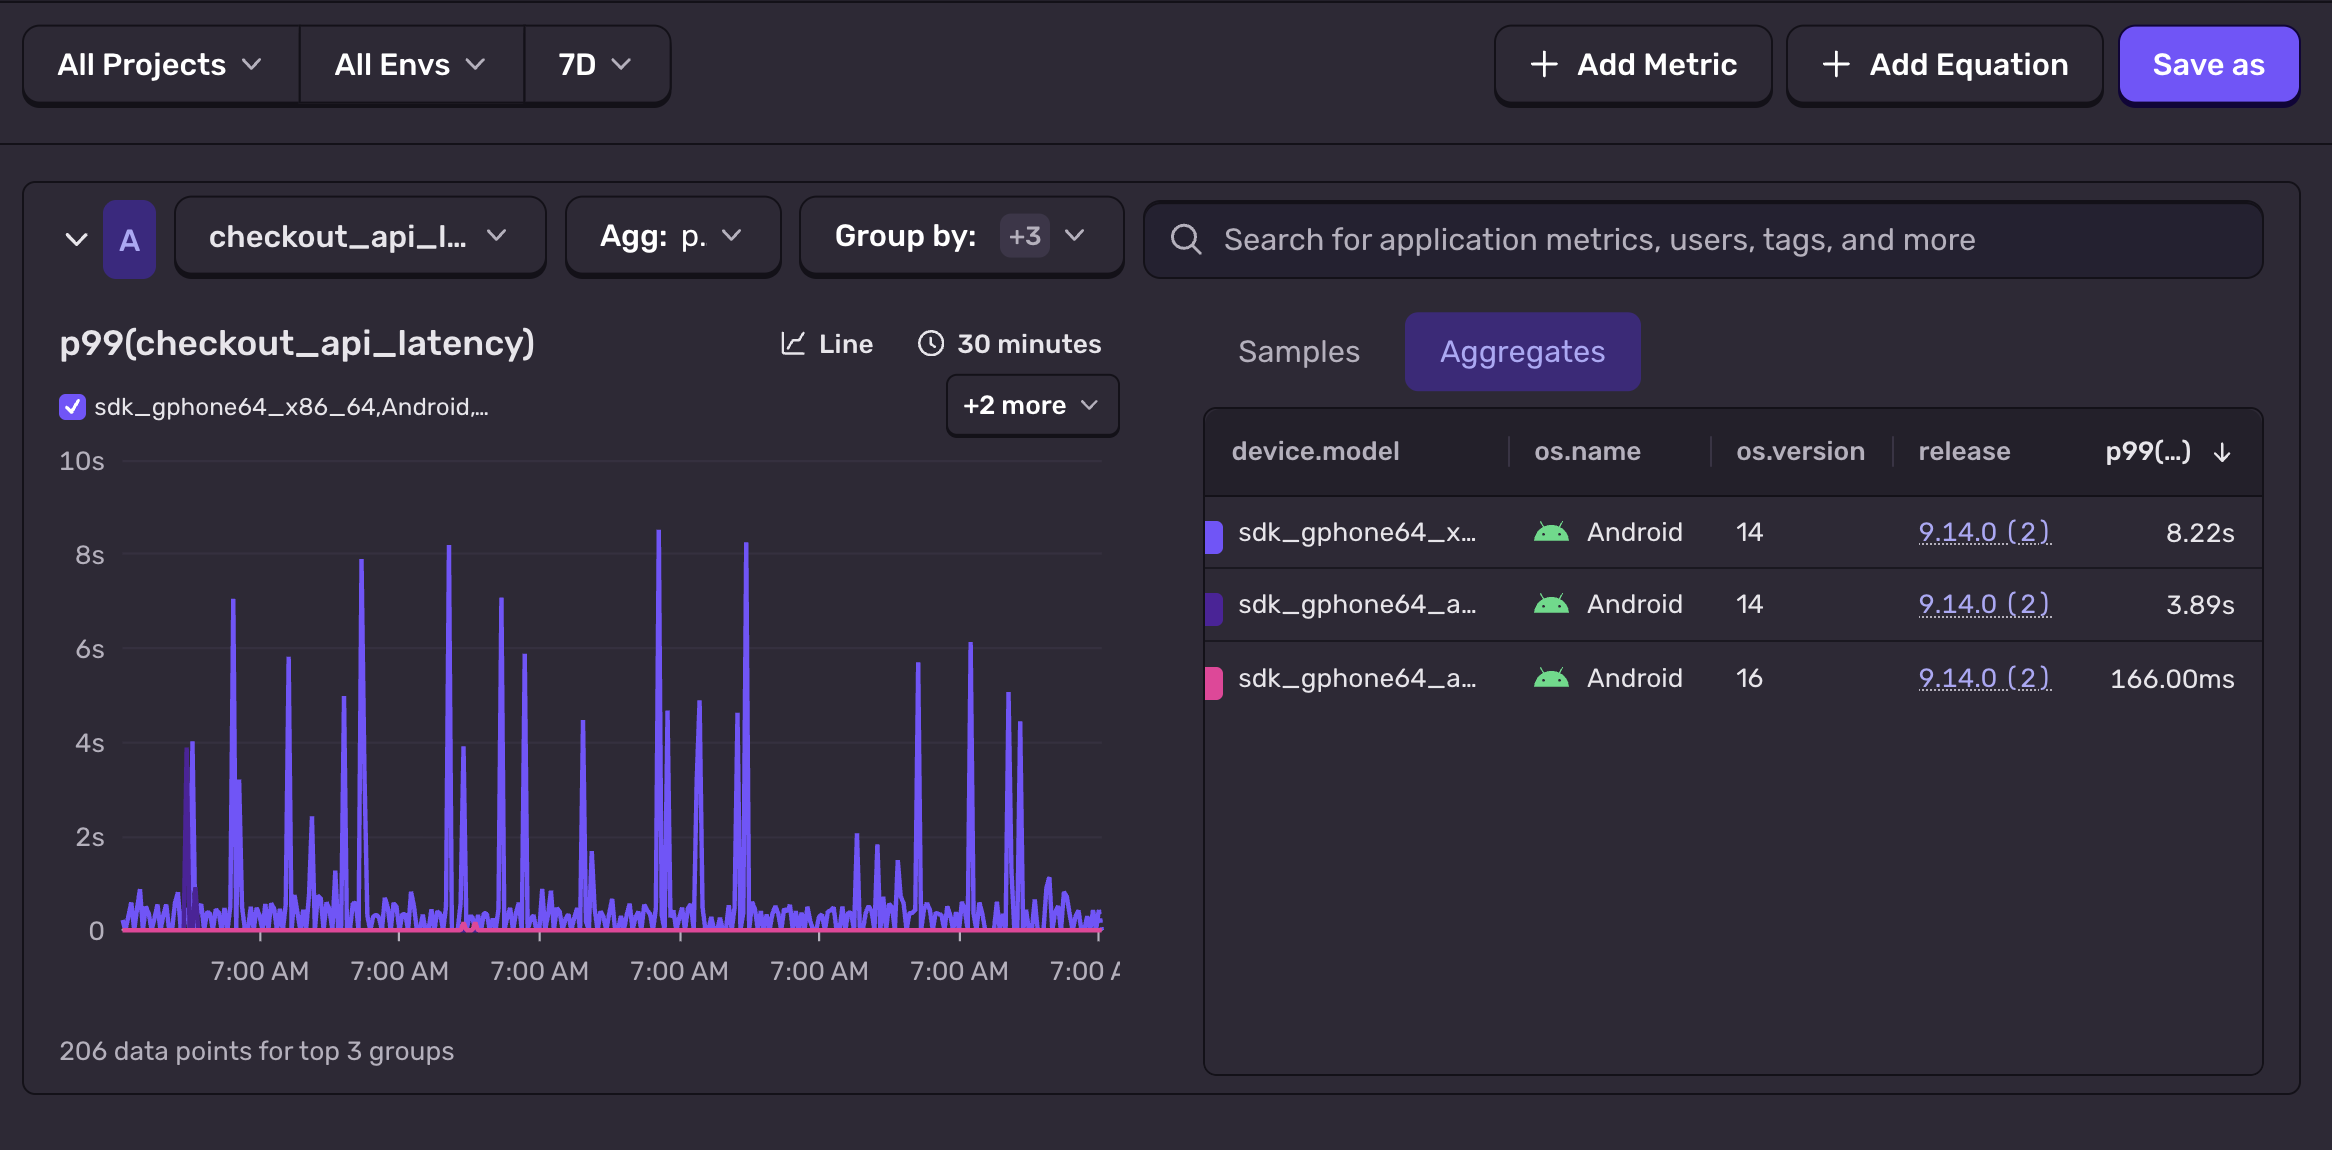
A spike isn't a number on a graph — it's a clickable path to the exact request, span, and line of code.

  • Drill from a p95 outlier into the slow span that produced it

  • Jump from a counter increment to the issue and stack trace behind it

  • Correlate metric movements with releases, feature flags, and deploys automatically

Read Docs

Instrument once. Ask anything.

Tag every measurement with the dimensions you actually debug with — customer_id, route, region, plan, build SHA. High cardinality is the default, not a limit. Emit raw measurements, then ask new questions later — without redeploying.

  • Counters, gauges, and distributions — first-class, with the tags you need

  • Slice and group after the fact — like grouping checkout.failed by customer_id

  • Filter with structured queries like route:"/checkout" AND region:"eu-west"

  • Alert on any structured dimension, not just pre-canned rollups

Read Docs

Get the answer from your metrics

Calculate error rates and conversion ratios from the metrics you already emit.

  • Aggregate by sum, avg, count, or p50/p95/p99

  • Combine up to 26 queries with equations like A / B for ratios, or (A + (B / 2)) / C for Apdex

  • Use derived series in dashboards and alerts

Read Docs

With Metrics, we can have a more central location for all our error tracking and data analysis.

I was able to get our first metrics in Sentry very quickly!

Application Metrics FAQs

All Sentry plans come with 5 GB. Additional usage beyond that costs $0.50/GB. Usage will be applied to your pay-as-you-go budget.

Traditional metrics tools punish you for the tags you actually need and live in a different tab from your errors and traces. Sentry treats high cardinality as the default for application-level signals, and links every emission to the trace and issue behind it.

The result: you go from a metric spike to the trace, span, and stack frame that caused it — without leaving Sentry.

Not today — and it's a deliberate choice. OTLP metrics are pre-aggregated before they reach us, which strips out the high-cardinality detail that makes our query model useful. If you need OTel-style infra metrics, pair Sentry with your existing metrics backend.

If you already have the Sentry SDK installed, you're a few lines away from emitting metrics. Call Sentry.metrics.count(), Sentry.metrics.gauge(), or Sentry.metrics.distribution() directly from your code — no separate import, no extra service to wire up. Release, environment, and SDK context are attached automatically.

Check out our docs to read more.

Of course we have more metrics content

Get monthly product updates from Sentry

Sign up for our newsletter.

And yes, it really is monthly. Ok, maybe the occasional twice a month, but for sure not like one of those daily ones that you just tune out after a while.

By filling out this form, you agree to our privacy policy. This form is protected by reCAPTCHA and Google's Privacy Policy and Terms of Service apply.

Fix It

Get started with the only application monitoring platform that empowers developers to fix application problems without compromising on velocity.