
Session Replay helps you see exactly what led up to an issue — but even short sessions can take time to watch. That’s why we’ve added a faster way to understand what happened.
Available under the Summary tab of any Replay, you’ll see a quick written overview of the user’s session, along with structured chapters that walk through each part of the experience—all in plain language.
Summaries help you make sense of the session at a glance, so you can jump straight to what matters and only watch the parts you care about.
What you'll see
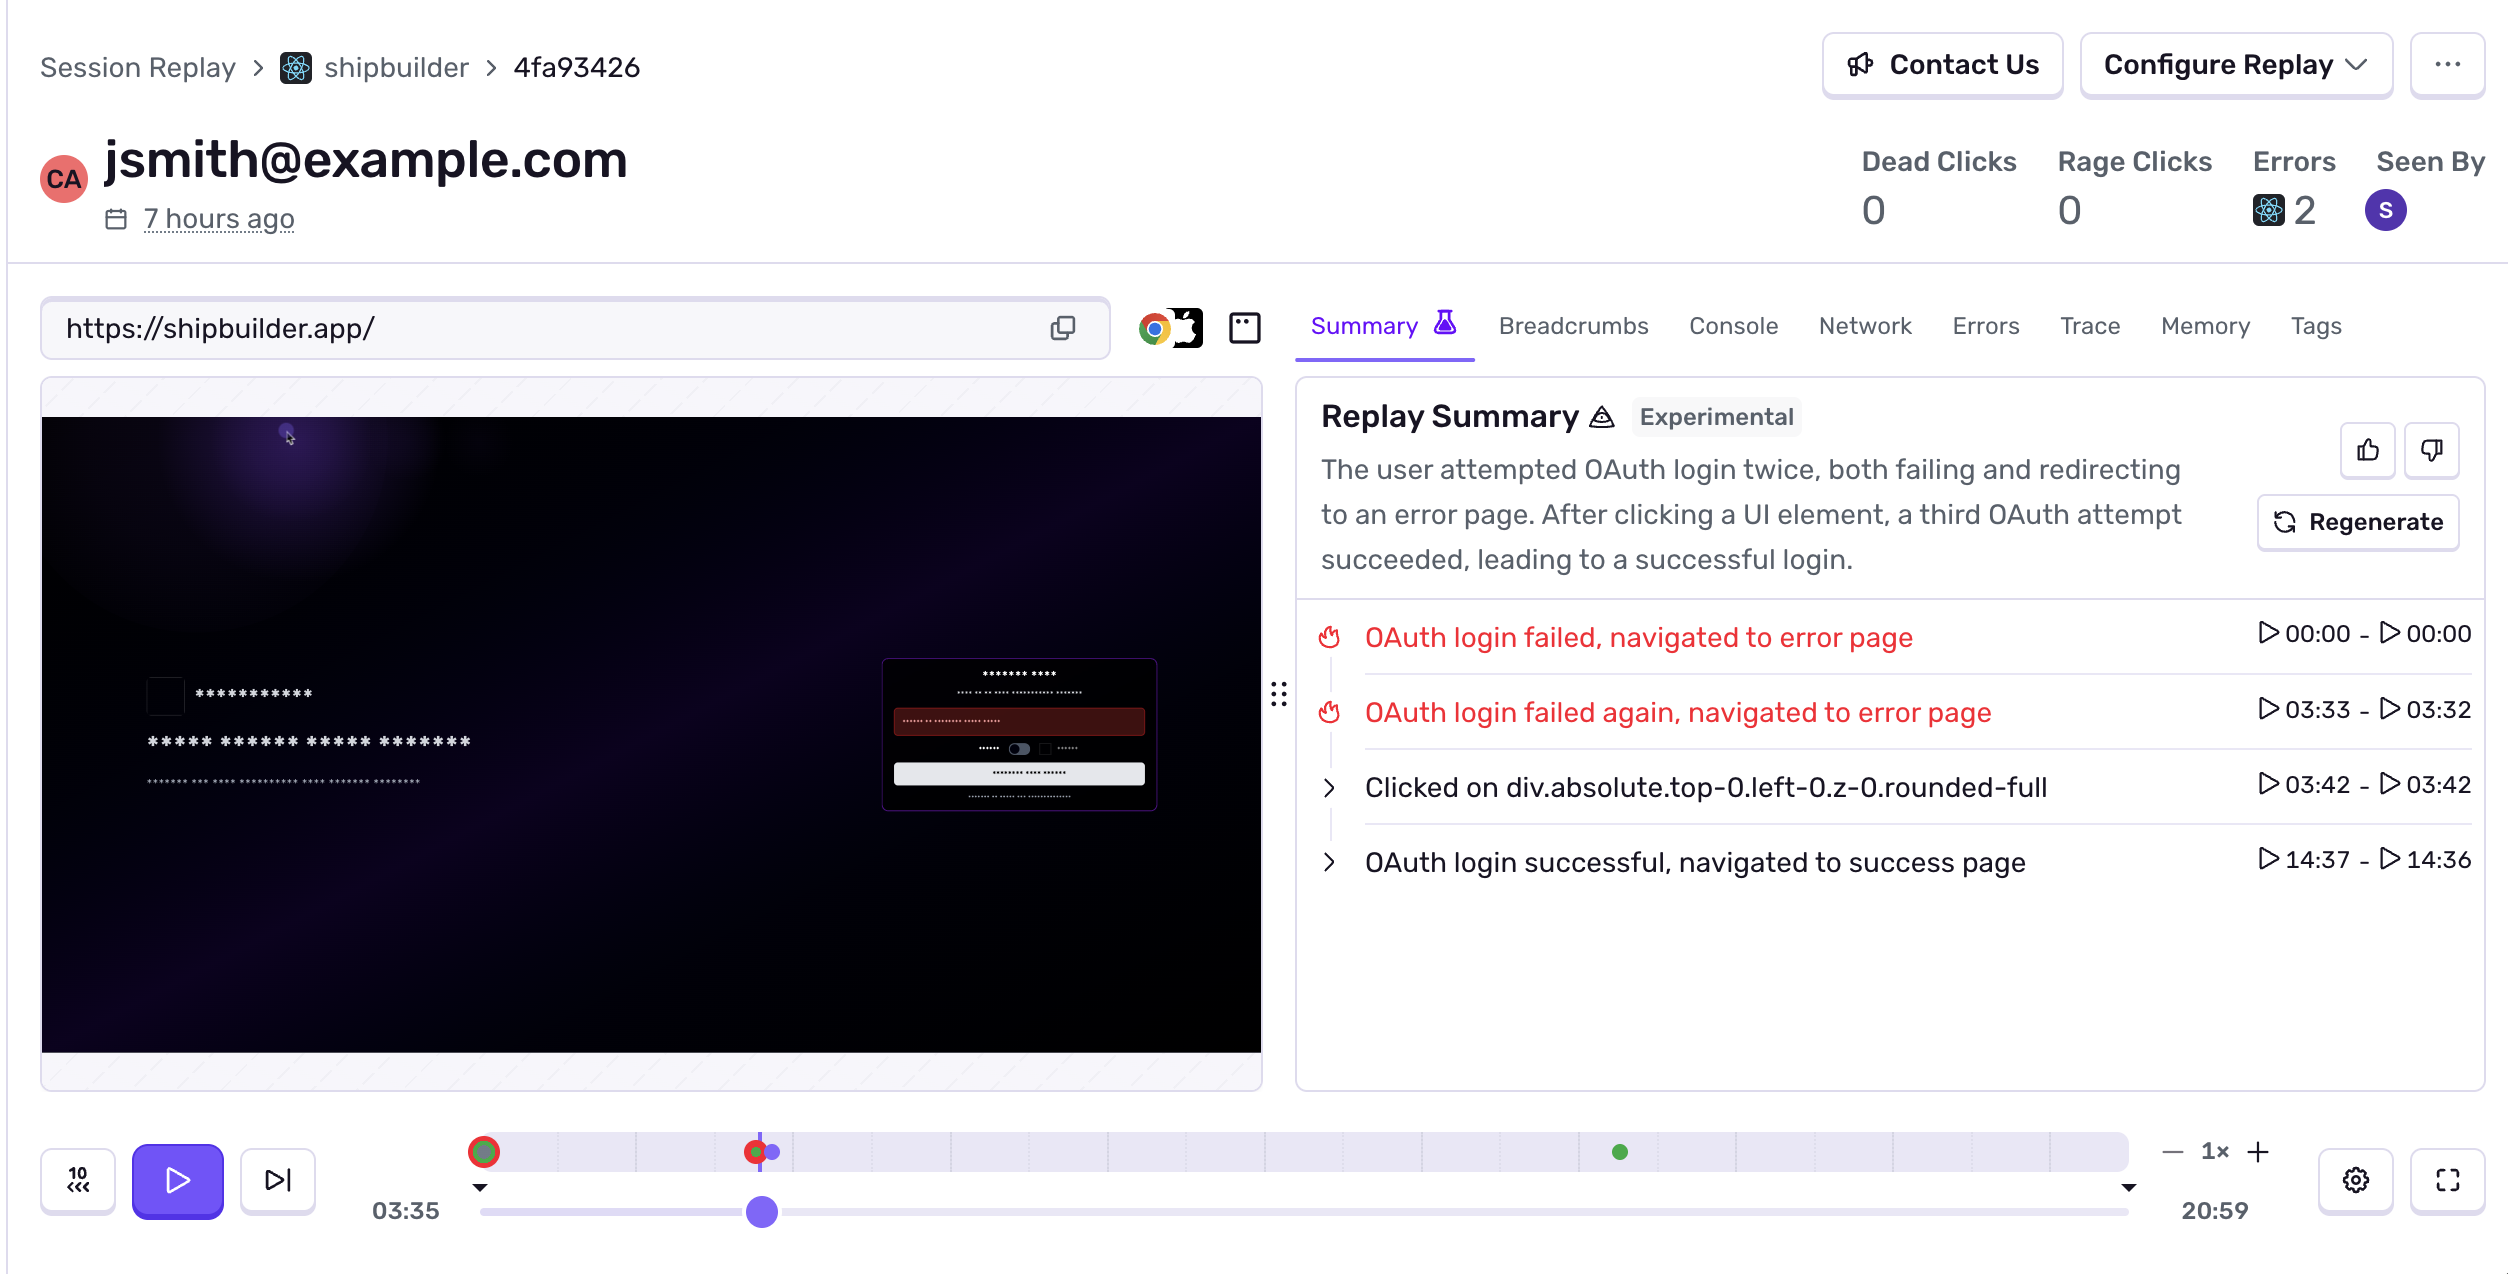
Sentry builds these narratives using deep context from across the session — not only the breadcrumbs, but also signals from the Console and Network tabs. We’re not just summarizing surface-level logs — we’re drawing from a full picture of what the browser and user were doing to tell a story that’s actually useful for debugging.
Feedback welcome
You can give a thumbs up or down on the summary and this will prompt our feedback widget so we can hear from you. We’re using that signal to fine-tune what makes a summary truly helpful.
How to get it
This feature is available to organizations that already have Session Replay installed and...
 Github