A single bad query can bring your app to a crawl and run up your DB bill, but finding it among all your EXPLAIN outputs is tough. Jump straight to the query causing delays with Tracing and Insights.
Distributed tracing: full context from click to database and back
Not sure why that API’s slow? Or where that crash came from? Sentry’s distributed tracing connects the full request path, from the first user action through every service and function call, so you find the root cause without digging through five different tools.
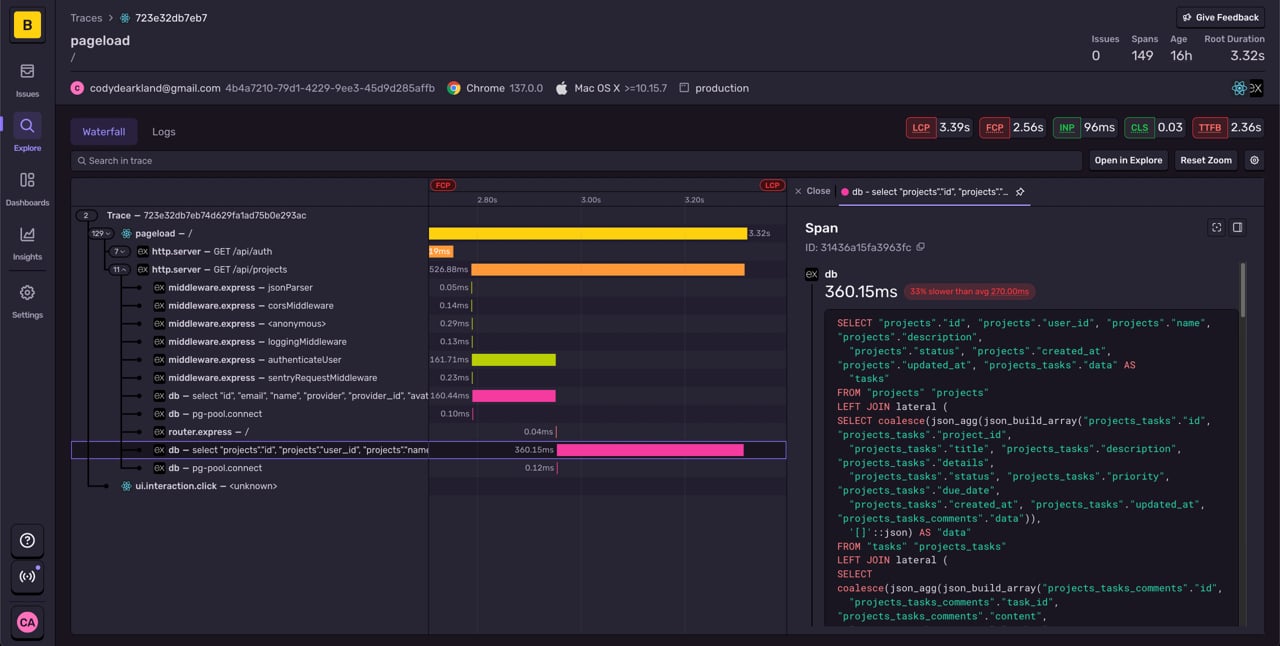
Find the exact query slowing your app
Pinpoint slow API calls across services
Your app usually loads fine, but some actions lag and you're not sure why. Trace Explorer shows which API calls are slow, whether it's an overloaded endpoint or a third-party service dragging. When spikes happen, filter by transaction, user, environment, or repo to find the cause.
Trace slow UI back to the bottleneck
A user taps "Place Order" and waits. The checkout fires multiple requests, but one API call is lagging. Trace Explorer breaks down the full flow so you can see which request is the bottleneck and fix it before users bail.
Debug vague LoadFailed errors
A missing module or failed request can break your app with a vague LoadFailed error and no clear cause. Instead of digging through network logs, use Sentry's Tracing to see the full chain of events. Whether it's a 404 on a missing file, a CORS rejection, or a Webpack resolution failure, you'll see exactly what happened.
More questions answered
Catch slowdowns before users notice
Set metric alerts on latency, error rate, or throughput for key spans like payment.stripe.charge. For dynamic patterns, use anomaly alerts to detect spikes or regressions without thresholds. Then jump into trace waterfalls to find the exact cause.
Surface performance regressions after deploys
Sentry surfaces performance issues like N+1 queries, slow database calls, and uncompressed assets. Each issue includes example traces, spans, and stack traces to show where time is spent. Quickly identify root causes, whether it's inefficient code, blocking I/O, or frontend bottlenecks.
Track span performance over time
Use span metrics to track latency, throughput, and failure rate for specific operations like db.query.user_by_id. Analyze trends over time, broken down by service, operation, or environment. Use filters to investigate performance regressions and set alerts on critical spans.
Debug errors in background jobs
With Sentry tracing, background jobs are part of the full request flow, so you can see what triggered them, how long they ran, and where they failed. Spans show job timing, retries, and related service calls. When a job errors, trace context connects it to user actions or upstream issues.
Monitor and debug AI agent runs
Monitor and debug AI agents like OpenAI and Vercel to see how they interact with your app. See prompt flows, model responses, and tool calls. Catch failures in tools, malformed outputs, or high token usage. Link issues to the triggering frontend or backend request to understand impact.
Monitoring a production environment is always a challenge, with regular deployments, third party integrations, and the cloud resources we depend on - the number of issues that can fire from any one system increases the complexity of figuring out which service or team owns what.
If our app is slow, users won't wait—they'll just leave. Using Sentry to debug and monitor performance is a key factor to our success in keeping users in our app and engaged.
Getting started with Sentry is simple
We support every technology (except the ones we don't).
Get started with just a few lines of code.
JavaScript
import * as Sentry from '@sentry/nextjs';

Sentry.init({
  dsn: 'https://examplePublicKey@o0.ingest.sentry.io/0',

  // We recommend adjusting this value in production, or using `tracesSampler`
  // for finer control
  tracesSampleRate: 1.0,
});
Java
import io.sentry.android.core.SentryAndroid;

SentryAndroid.init(this, options -> {
  options.setDsn("https://examplePublicKey@o0.ingest.sentry.io/0");
  // To set a uniform sample rate
  options.setTracesSampleRate(1.0);
  // OR if you prefer, determine traces sample rate based on the sampling context
  options.setTracesSampler(
      context -> {
        // return a number between 0 and 1 or null (to fallback to configured value)
      });
});
JavaScript
// If you're using one of our framework SDK packages, like `@sentry/react`,
// substitute its name for `@sentry/browser` here
import * as Sentry from '@sentry/browser';

Sentry.init({
  dsn: 'https://examplePublicKey@o0.ingest.sentry.io/0',

  // This enables automatic instrumentation (highly recommended),
  // but is not necessary for purely manual usage
  // If you only want to use custom instrumentation:
  // * Remove the `BrowserTracing` integration
  // * add `Sentry.addTracingExtensions()` above your Sentry.init() call
  integrations: [Sentry.browserTracingIntegration()],

  // We recommend adjusting this value in production, or using tracesSampler
  // for finer control
  tracesSampleRate: 1.0,

  // Set `tracePropagationTargets` to control for which URLs distributed tracing should be enabled
  tracePropagationTargets: ['localhost', /^https:\/\/yourserver\.io\/api/],
});
C#
using Sentry;

// Add this to the SDK initialization callback
// Example uniform sample rate: capture 100% of transactions
options.TracesSampleRate = 1.0;
Either set tracesSampleRate in your astro.config.mjs file or in sentry.(client|server).init.js:
JavaScript
/* astro.config.mjs */

import {defineConfig} from 'astro/config';
import sentryAstro from '@sentry/astro';

export default defineConfig({
  integrations: [
    sentryAstro({
      dsn: 'https://examplePublicKey@o0.ingest.sentry.io/0',
      tracesSampleRate: 1.0,
    }),
  ],
});
JavaScript
/* sentry.(client|server).init.js */

import * as Sentry from '@sentry/astro';

Sentry.init({
  dsn: 'https://examplePublicKey@o0.ingest.sentry.io/0',
  tracesSampleRate: 1.0,
});
Swift
import Sentry

SentrySDK.start { options in
    options.dsn = "https://examplePublicKey@o0.ingest.sentry.io/0"

    // Example uniform sample rate: capture 100% of transactions
    // In Production you will probably want a smaller number such as 0.5 for 50%
    options.tracesSampleRate = 1.0

    // OR if you prefer, determine traces sample rate based on the
    // sampling context
    options.tracesSampler = { context in
         // Don't miss any transactions for VIP users
        if context?["vip"] as? Bool == true {
            return 1.0
        } else {
            return 0.25 // 25% for everything else
        }
    }
}
C#
using Sentry;

// Add this to the SDK initialization callback
// Example uniform sample rate: capture 100% of transactions
options.TracesSampleRate = 1.0;
Go
func main() {
	err := sentry.Init(sentry.ClientOptions{
		// ...

		EnableTracing: true,
		// Specify a fixed sample rate:
		// We recommend adjusting this value in production
		TracesSampleRate: 1.0,
		// Or provide a custom sample rate:
		TracesSampler: sentry.TracesSampler(func(ctx sentry.SamplingContext) float64 {
			// As an example, this does not send some
			// transactions to Sentry based on their name.
			if ctx.Span.Name == "GET /health" {
				return 0.0
			}

			return 1.0
		}),
	})
}
JavaScript
// If you're using one of our framework SDK packages, like `@sentry/react`,
// substitute its name for `@sentry/browser` here
import * as Sentry from '@sentry/browser';

Sentry.init({
  dsn: 'https://examplePublicKey@o0.ingest.sentry.io/0',

  // This enables automatic instrumentation (highly recommended),
  // but is not necessary for purely manual usage
  // If you only want to use custom instrumentation:
  // * Remove the `BrowserTracing` integration
  // * add `Sentry.addTracingExtensions()` above your Sentry.init() call
  integrations: [Sentry.browserTracingIntegration()],

  // We recommend adjusting this value in production, or using tracesSampler
  // for finer control
  tracesSampleRate: 1.0,

  // Set `tracePropagationTargets` to control for which URLs distributed tracing should be enabled
  tracePropagationTargets: ['localhost', /^https:\/\/yourserver\.io\/api/],
});
PHP
/* config/sentry.php */

// Specify a fixed sample rate:
'traces_sample_rate' => 0.2,
// Or provide a custom sampler:
'traces_sampler' => function (\Sentry\Tracing\SamplingContext $context): float {
    // return a number between 0 and 1
},
PHP
\Sentry\init([
    'dsn' => 'https://examplePublicKey@o0.ingest.sentry.io/0',
    // Specify a fixed sample rate:
    'traces_sample_rate' => 0.2,
    // Or provide a custom sampler:
    'traces_sampler' => function (\Sentry\Tracing\SamplingContext $context): float {
        // return a number between 0 and 1
    },
]);
Python
import sentry_sdk

sentry_sdk.init(
    dsn="https://examplePublicKey@o0.ingest.sentry.io/0",
    traces_sample_rate=1.0,
)
JavaScript
import {createBrowserRouter} from 'react-router-dom';
import * as Sentry from '@sentry/react';

Sentry.init({
  dsn: 'https://examplePublicKey@o0.ingest.sentry.io/0',

  // This enables automatic instrumentation (highly recommended)
  // If you only want to use custom instrumentation:
  // * Remove the `BrowserTracing` integration
  // * add `Sentry.addTracingExtensions()` above your Sentry.init() call
  integrations: [
    Sentry.browserTracingIntegration(),
    // Or, if you are using react router, use the appropriate integration
    // See docs for support for different versions of react router
    // https://docs.sentry.io/platforms/javascript/guides/react/configuration/integrations/react-router/
    Sentry.reactRouterV6BrowserTracingIntegration({
      useEffect: React.useEffect,
      useLocation,
      useNavigationType,
      createRoutesFromChildren,
      matchRoutes,
    }),
  ],

  // For finer control of sent transactions you can adjust this value, or
  // use tracesSampler
  tracesSampleRate: 1.0,

  // Set `tracePropagationTargets` to control for which URLs distributed tracing should be enabled
  tracePropagationTargets: ['localhost', /^https:\/\/yourserver\.io\/api/],
});
Ruby
Sentry.init do |config|
  #...

  # Set a uniform sample rate between 0.0 and 1.0
  # We recommend adjusting the value in production:
  config.traces_sample_rate = 1.0

  # or control sampling dynamically
  config.traces_sampler = lambda do |sampling_context|
    # sampling_context[:transaction_context] contains the information about the transaction
    # sampling_context[:parent_sampled] contains the transaction's parent's sample decision
    true # return value can be a boolean or a float between 0.0 and 1.0
  end
end
Configure sample rate in application.properties or application.yml file:
Java
# Set traces_sample_rate to 1.0 to capture 100%
# of transactions for performance monitoring.
# We recommend adjusting this value in production.
sentry.traces-sample-rate=1.0
Or through providing a bean of type SentryOptions#TracesSamplerCallback:
Java
import io.sentry.SentryOptions.TracesSamplerCallback;
import io.sentry.SamplingContext;
import org.springframework.stereotype.Component;

@Component
class CustomTracesSamplerCallback implements TracesSamplerCallback {
  @Override
  public Double sample(SamplingContext context) {
    CustomSamplingContext customSamplingContext = context.getCustomSamplingContext();
    if (customSamplingContext != null) {
      HttpServletRequest request = (HttpServletRequest) customSamplingContext.get("request");
      // return a number between 0 and 1 or null (to fallback to configured value)
    } else {
      // return a number between 0 and 1 or null (to fallback to configured value)
    }
  }
}
JavaScript
// If you're using one of our framework SDK packages, like `@sentry/react`,
// substitute its name for `@sentry/browser` here
import * as Sentry from '@sentry/browser';

Sentry.init({
  dsn: 'https://examplePublicKey@o0.ingest.sentry.io/0',

  // This enables automatic instrumentation (highly recommended),
  // but is not necessary for purely manual usage
  // If you only want to use custom instrumentation:
  // * Remove the `BrowserTracing` integration
  // * add `Sentry.addTracingExtensions()` above your Sentry.init() call
  integrations: [Sentry.browserTracingIntegration()],

  // We recommend adjusting this value in production, or using tracesSampler
  // for finer control
  tracesSampleRate: 1.0,

  // Set `tracePropagationTargets` to control for which URLs distributed tracing should be enabled
  tracePropagationTargets: ['localhost', /^https:\/\/yourserver\.io\/api/],
});
JavaScript
import Vue from 'vue';
import * as Sentry from '@sentry/vue';

Sentry.init({
  // Passing in `Vue` is optional, if you do not pass it `window.Vue` must be present.
  Vue: Vue,
  dsn: 'https://examplePublicKey@o0.ingest.sentry.io/0',

  // This enables automatic instrumentation (highly recommended),
  // but is not necessary for purely manual usage
  // If you only want to use custom instrumentation:
  // * Remove the `BrowserTracing` integration
  // * add `Sentry.addTracingExtensions()` above your Sentry.init() call
  integrations: [Sentry.browserTracingIntegration()],

  // We recommend adjusting this value in production, or using tracesSampler
  // for finer control
  tracesSampleRate: 1.0,
  // Set `tracePropagationTargets` to control for which URLs distributed tracing should be enabled
  tracePropagationTargets: ['localhost', /^https:\/\/yourserver\.io\/api/],
});Distributed tracing FAQs
Tracing provides a connected view of related errors and transactions by capturing interactions among your software systems. With Tracing, Sentry tracks your software performance and displays the impact of errors across multiple systems.
Tracing is available for all languages and platforms that Sentry supports. See the full list here.
To enable Tracing capabilities you need to purchase spans. See docs for pricing details.
To use Tracing, you will first need a Sentry account. If you don’t have a Sentry account, you can create one here. Then, follow the instructions in our docs to use Tracing.
Yes, you can configure your OpenTelemetry SDK to send traces and spans to Sentry. Learn more.
Agent tracing follows a single AI agent run from start to finish as a connected trace, capturing every LLM call, tool execution, and handoff as a span with its inputs, outputs, token counts, cost, and timing. Because AI agents make decisions across many steps, a flat log isn't enough; agent tracing shows you the full execution path so you can see exactly which step failed or stalled. See how agent tracing works in Sentry.
Of course there’s more to distributed tracing


Get monthly product updates from Sentry
Sign up for our newsletter.
And yes, it really is monthly. Ok, maybe the occasional twice a month, but for sure not like one of those daily ones that you just tune out after a while.
Fix It
Get started with the only application monitoring platform that empowers developers to fix application problems without compromising on velocity.