NestJS Error and Performance Monitoring
Actionable insights to resolve NestJS performance bottlenecks and errors. Improve your NestJS monitoring workflow with a full view of releases so you can mark errors as resolved and prioritize live issues.
Getting Started is Simple
Add @sentry/nestjs as a dependency:
npm install --save @sentry/nestjs
You need to create a file named instrument.js that imports and initializes Sentry:
import * as Sentry from '@sentry/nestjs';

// Ensure to call this before importing any other modules!
Sentry.init({
  dsn: 'https://examplePublicKey@o0.ingest.sentry.io/0',

  // Add Tracing by setting tracesSampleRate
  // We recommend adjusting this value in production
  tracesSampleRate: 1.0,
});
You need to require or import the instrument.js file before requiring any other modules in your application. This is necessary to ensure that Sentry can automatically instrument all modules in your application:
// Import this first!
import './instrument';

// Now import other modules
import { NestFactory } from "@nestjs/core";
import { AppModule } from "./app.module";

async function bootstrap() {
  const app = await NestFactory.create(AppModule);
  await app.listen(3000);
}

bootstrap();
Afterwards, add the SentryModule as a root module to your main module:
import { Module } from "@nestjs/common";
import { SentryModule } from "@sentry/nestjs/setup";
import { AppController } from "./app.controller";
import { AppService } from "./app.service";

@Module({
  imports: [
    SentryModule.forRoot(),
    // ...other modules
  ],
  controllers: [AppController],
  providers: [AppService],
})
export class AppModule {}
In case you are using a global catch-all exception filter (which is either a filter registered with app.useGlobalFilters() or a filter registered in your app module providers annotated with an empty @Catch() decorator), add a @WithSentry() decorator to the catch() method of this global error filter. This decorator will report all unexpected errors that are received by your global error filter to Sentry:
import { Catch, ExceptionFilter } from '@nestjs/common';
import { WithSentry } from '@sentry/nestjs';

@Catch()
export class YourCatchAllExceptionFilter implements ExceptionFilter {
  @WithSentry()
  catch(exception, host): void {
    // your implementation here
  }
}
In case you do not have a global catch-all exception filter, add the SentryGlobalFilter to the providers of your main module. This filter will report all unhandled errors that are not caught by any other error filter to Sentry. Important: The SentryGlobalFilter needs to be registered before any other exception filters.
import { Module } from '@nestjs/common';
import { APP_FILTER } from '@nestjs/core';
import { SentryGlobalFilter } from '@sentry/nestjs/setup';

@Module({
  providers: [
    {
      provide: APP_FILTER,
      useClass: SentryGlobalFilter,
    },
    // ..other providers
  ],
})
export class AppModule {}
Check our documentation for the latest instructions.
See all platforms
Powered by OpenTelemetry
Sentry works with OpenTelemetry to provide a simple configuration process, and rich distributed tracing context across all the libraries and frameworks used in your application. Regardless of your chosen tech stack.

NestJS Performance Monitoring
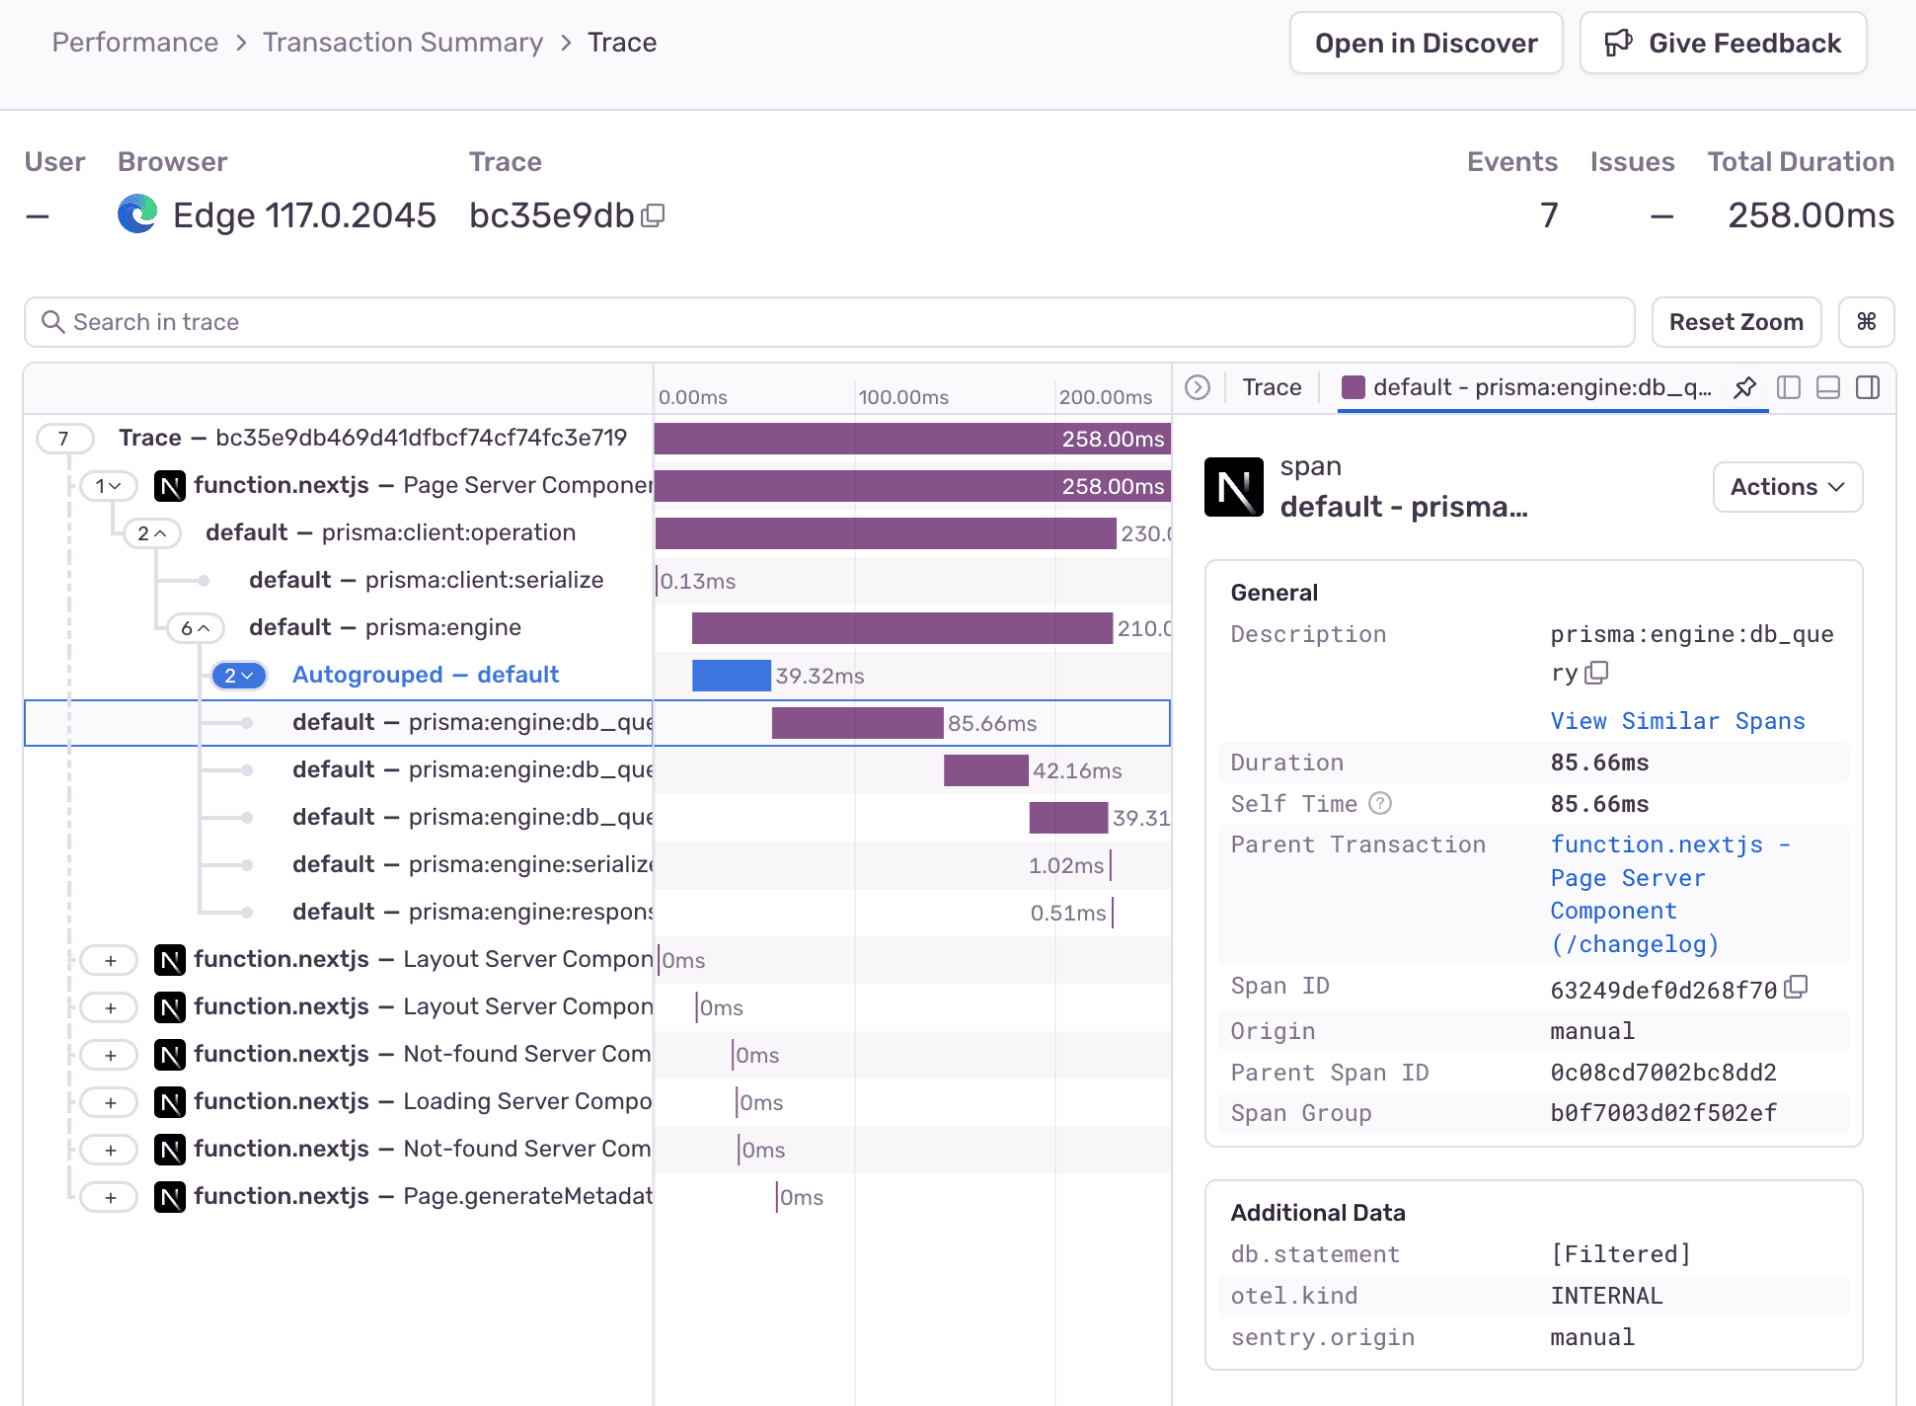
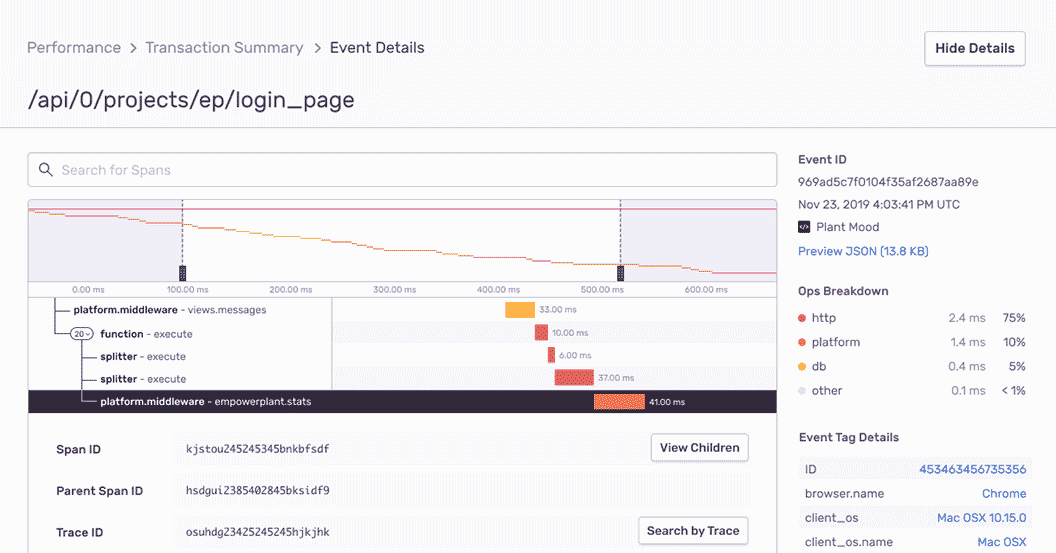
Quickly identify NestJS performance issues and view full end-to-end distributed trace to see the exact, poor-performing API call and surface any related errors.

NestJS Error Monitoring with Complete Stack Traces
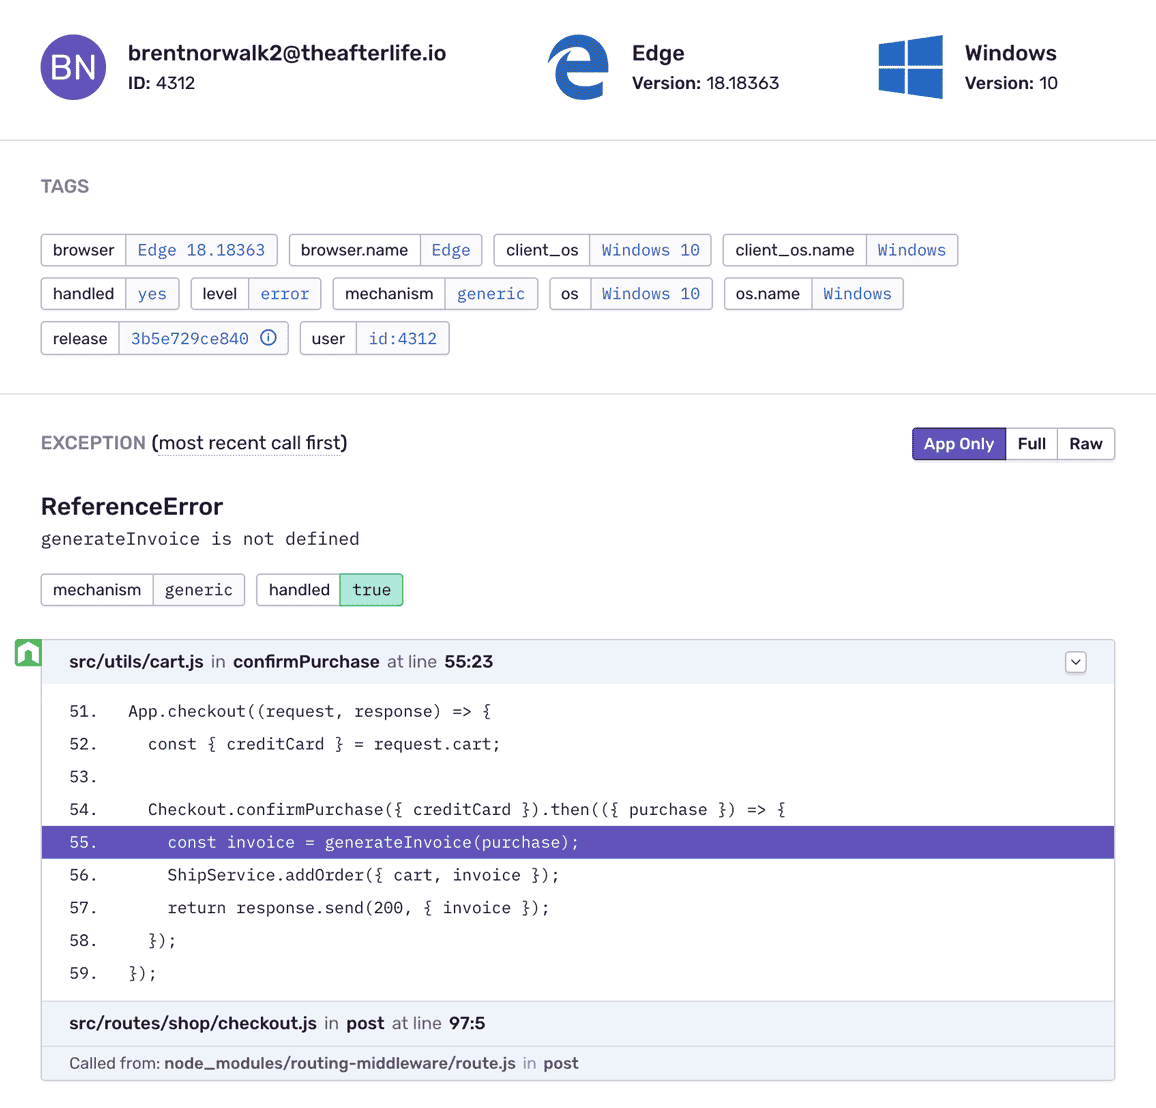
See the NestJS source code at each frame instead of settings for just line and column numbers. Get proper asynchronous context tracking — like thread-local store — in a way that fits Node’s concurrency model.

Fill In The Blanks About NestJS Errors
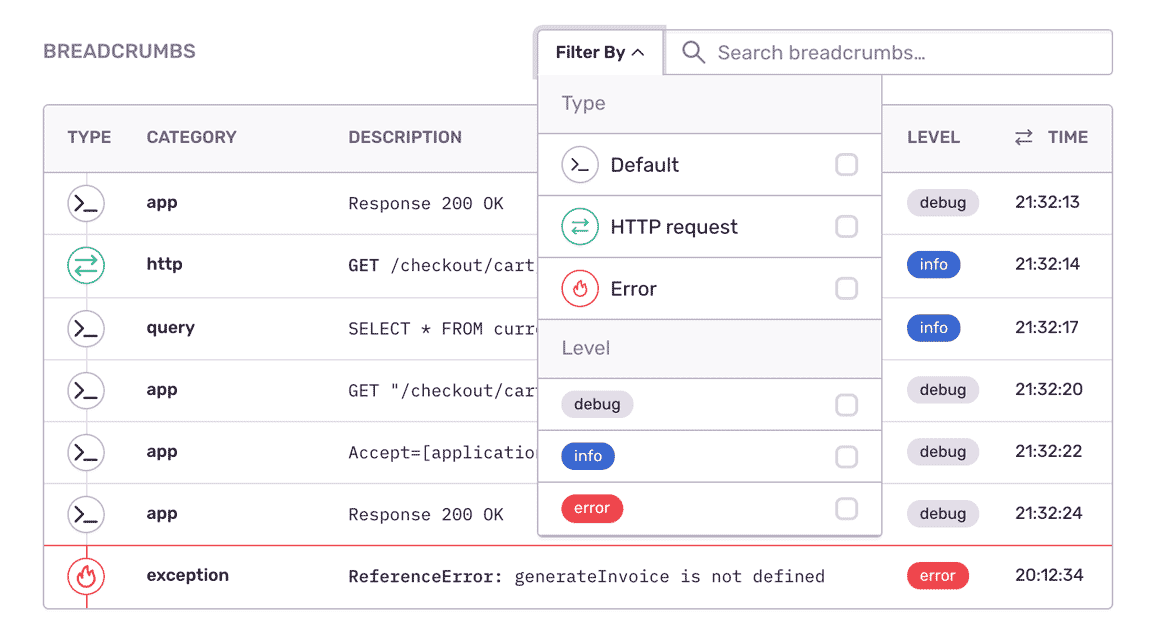
See what the app was doing when the NestJS error occurred: HTTP requests, database queries, console loft statements, etc.
NestJS Application Profiling
Profiling lets you see what parts of your code are consuming the most resources, like CPU or memory, in your application— so you can optimize them before end user experience is impacted. Test your application performance in any environment, including in production, without writing manual tests or extensive troubleshooting.
Try Profiling“Sentry’s high-quality tooling helps Disney+ maintain high-quality service to its tens of millions of global subscribers.”
Debugging Any NestJS Exception
Aggregate errors by factors like request details, user ID, and event level to see what’s new, a priority, or a trend.
Assign custom key-value tags to reproduce the error environment specific to your application, business, and users.
Find answers to key questions: Has an error with the same stack occurred before? In which app release did the NestJS bug occur?
It’s why companies that don’t have a complete view of their infrastructure are being punished:
The average cost of network downtime is around $5,600 per minute — or $300,000 per hour.
1 out of 5 online shoppers will abandon their cart because the transaction process was too slow.
On average, a two-second slowdown in page load decreases revenues by 4.3 percent.