Continuous & UI Profiling
Don’t just identify slowdowns—understand exactly why they happen. Profile your backend and mobile app code continuously to find performance bottlenecks down to the exact function and line of code.

Solve Performance Problems at the Source (Code)
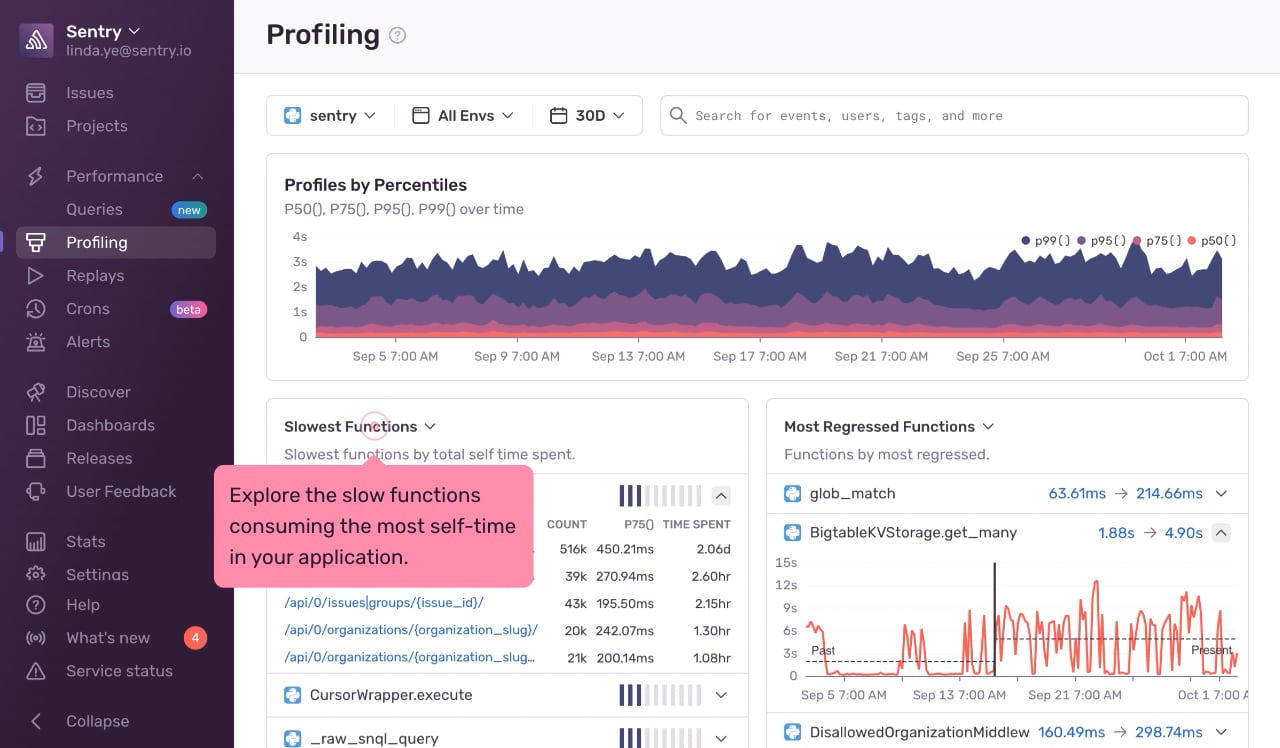
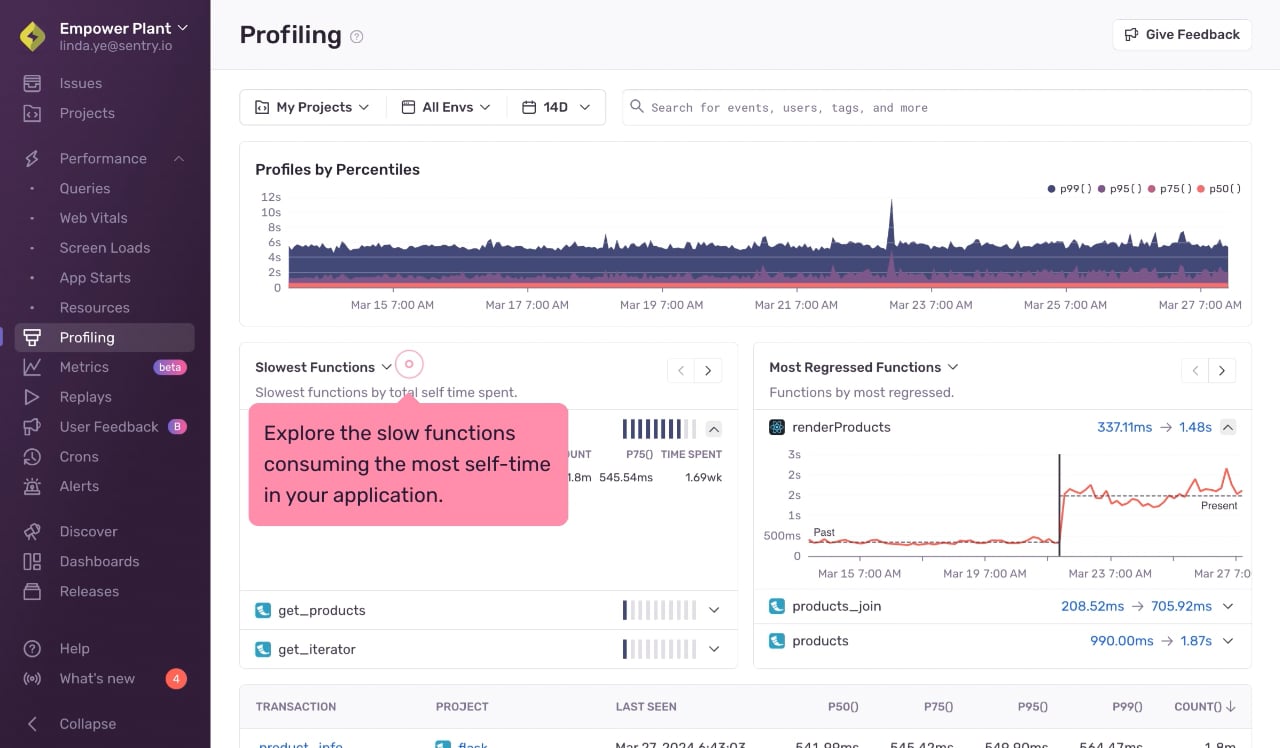
Stop guessing where your code might be slow with granular, unlimited-duration profiling for Node.js and Python. Spot CPU spikes, deep recursion and batch jobs that would otherwise be hidden in code, then jump straight to the slowest or most redundant function.
Capture full UI thread execution on iOS and Android to catch frame drops, slow renders, and heavy SDK callbacks. Know exactly which method or library is dragging down responsiveness or app load times.
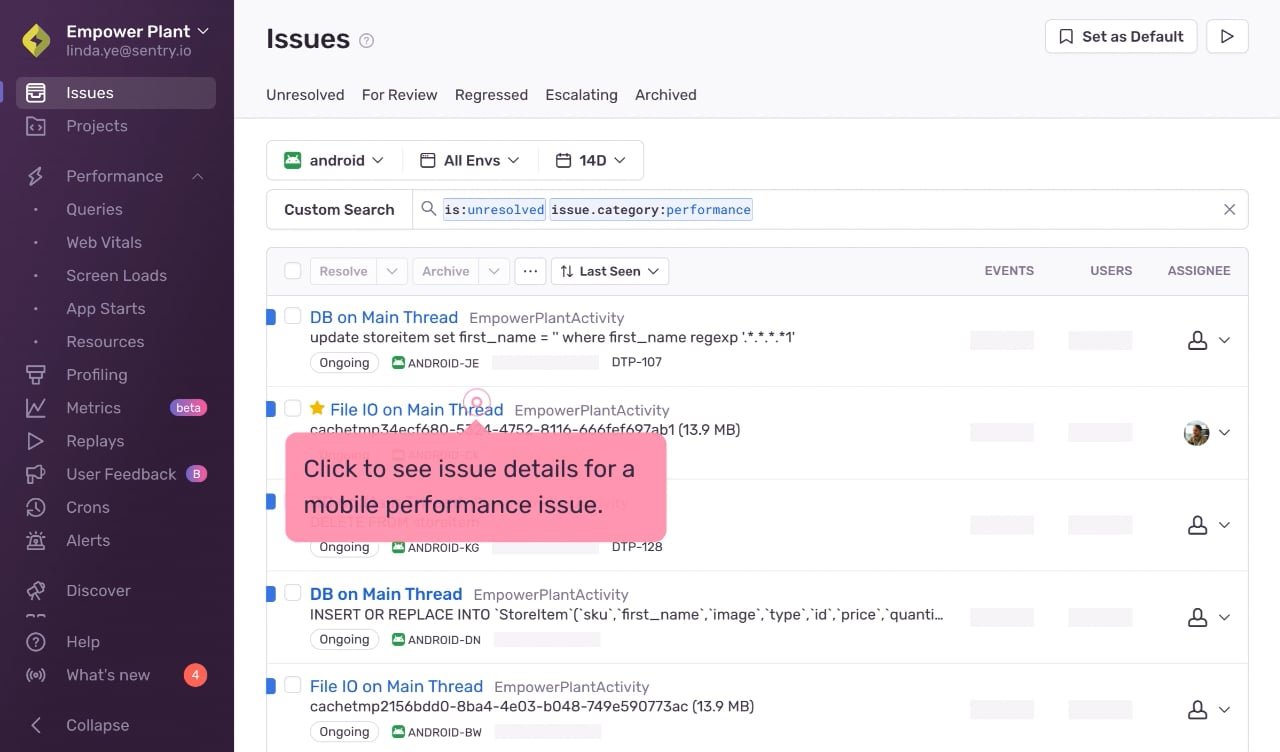
Sentry surfaces performance issues like image decoding or JSON parsing that block the main thread. View the full stack trace, distributed trace, and function-level detail—then triage and verify the fix right in Sentry.
With flame graphs, we were able to find our slowest database requests for our customer payment services. Using Sentry Profiling, we’ve been able to reduce the time-to-execution of our requests from 1000ms to 300ms.
Sentry Profiling helped us identify our largest performance bottlenecks and dive deeper into our applications to ensure an optimal level of performance for our customers. We were able to optimize slow database queries and make our API response time 13x faster.

Grab the Sentry SDK
Configure your DSN
Grab the Sentry Node SDK:
npm install @sentry/nodeConfigure your SDK:
const Sentry = require('@sentry/node');
Sentry.init({ dsn: 'https://<key>@sentry.io/<project>' });
Grab the Sentry Python SDK:
pip install --upgrade sentry-sdkConfigure your DSN:
import sentry_sdk

sentry_sdk.init(
    "https://<key>@sentry.io/<project>",

    # Set traces_sample_rate to 1.0 to capture 100%
    # of transactions for Tracing.
    # We recommend adjusting this value in production.
    enable_tracing=True,
    traces_sample_rate=1.0,
)
Just run this command to sign up for and install Sentry.
brew install getsentry/tools/sentry-wizard && sentry-wizard -i androidSignup and install Sentry with just one line of code:
brew install getsentry/tools/sentry-wizard && sentry-wizard -i iosInstall Sentry with one line of code:
npx @sentry/wizard@latest -i reactNativeGrab the Sentry JavaScript SDK:
<script src="https://browser.sentry-cdn.com/<VERSION>/bundle.min.js"></script>Configure your DSN:
Sentry.init({ dsn: 'https://<key>@sentry.io/<project>',
  // This enables automatic instrumentation (highly recommended),
  // but is not necessary for purely manual usage
  // If you only want to use custom instrumentation:
  // * Remove the BrowserTracing integration
  // * add Sentry.addTracingExtensions() above your Sentry.init() call
  integrations: [Sentry.browserTracingIntegration()],

  // We recommend adjusting this value in production, or using tracesSampler
  // for finer control
  tracesSampleRate: 1.0,

  // Set tracePropagationTargets to control for which URLs distributed tracing should be enabled
  tracePropagationTargets: ['localhost', /^https://yourserver.io/api/],
});FAQs
Profiling gives code-level insight into your application performance in a variety of environments, including in production. By periodically capturing information about the code running in your app during a performance transaction, Sentry’s Profiling tool helps pinpoint the exact functions in your code that are consuming excessive CPU and causing performance problems – whether it’s loading screen issues or stuttering scrolls for the frontend user, or heavy infrastructure costs on the backend – so you can take action and fix them quickly.
Profiling supports Browser JavaScript, Python, Node, PHP, Android, and iOS SDKs. Our PHP support includes Laravel and Symfony. Our mobile support is limited to native iOS (Swift and Objective-C only) and Android (Java and Kotlin only). Other platform support is coming soon.
Core performance monitoring functionality like Tracing gives you a high-level overview of your system’s performance, relying on transactions to tell you what is slow and to measure how long it takes. Profiling helps you understand why it’s slow at the code-level, pinpointing the exact file/line number causing the slow request.
Think of profiling as taking a magnifying glass to a transaction or span and seeing exactly what’s happening in the app while that transaction or span is captured. The additional context provided by a profile associated with a transaction can help you quickly debug and fix your performance issue.
Read more about how Profiling complements Tracing and improves your Performance experience here.
You’ll first have to enable performance monitoring in your app (which takes just 5 lines of code). Profiling hooks into the existing performance transactions in your app so there is no additional work to integrate beyond just enabling profiling in the SDK configuration.
The cost of Profiling is based on a unit consumption model that allows customers to pay for only what they need. Please check out our pricing page for details.


