Github
 Slack
Slack

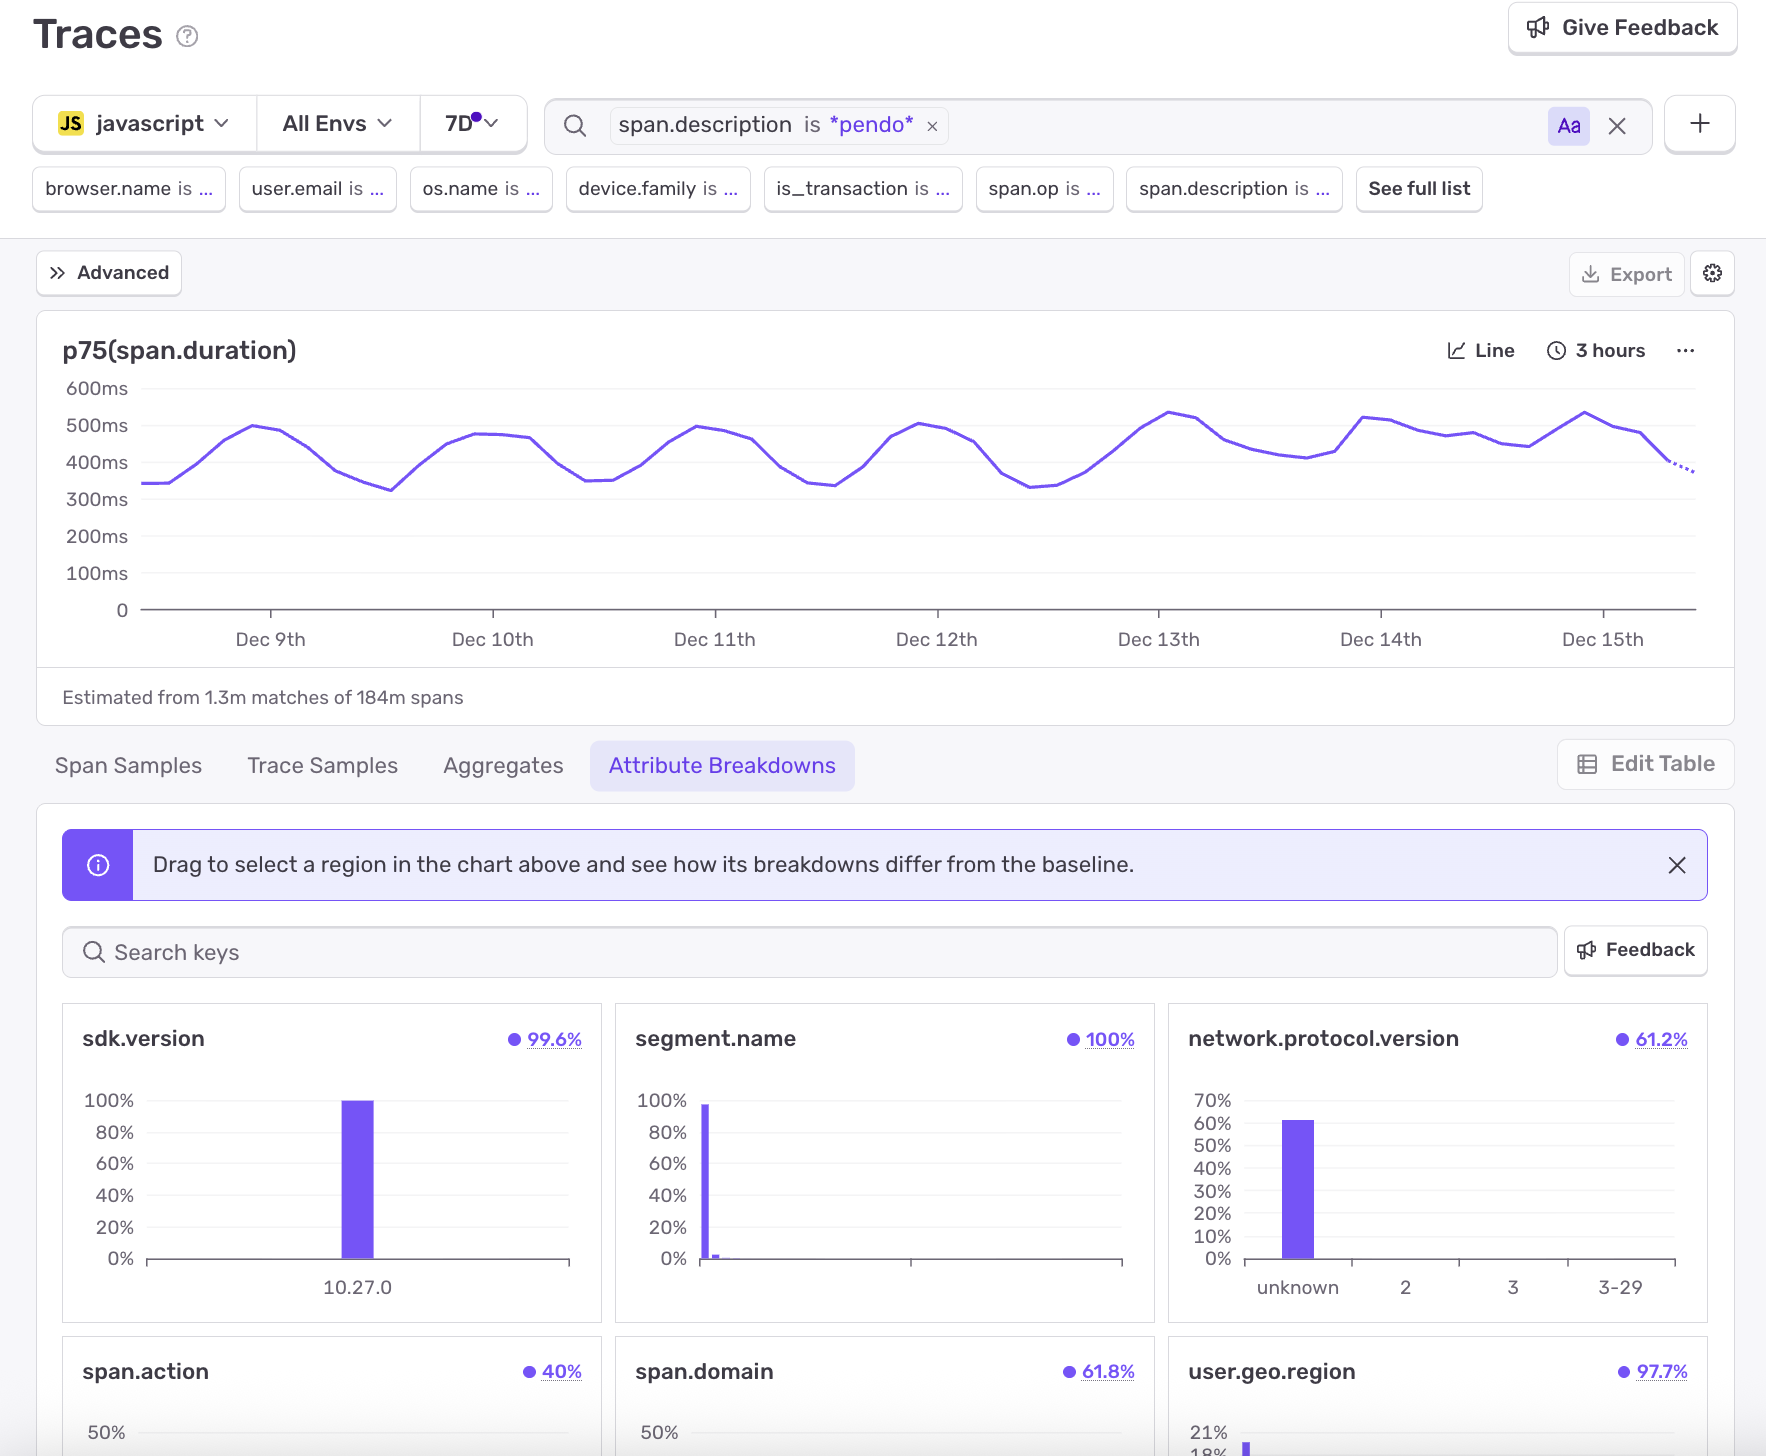
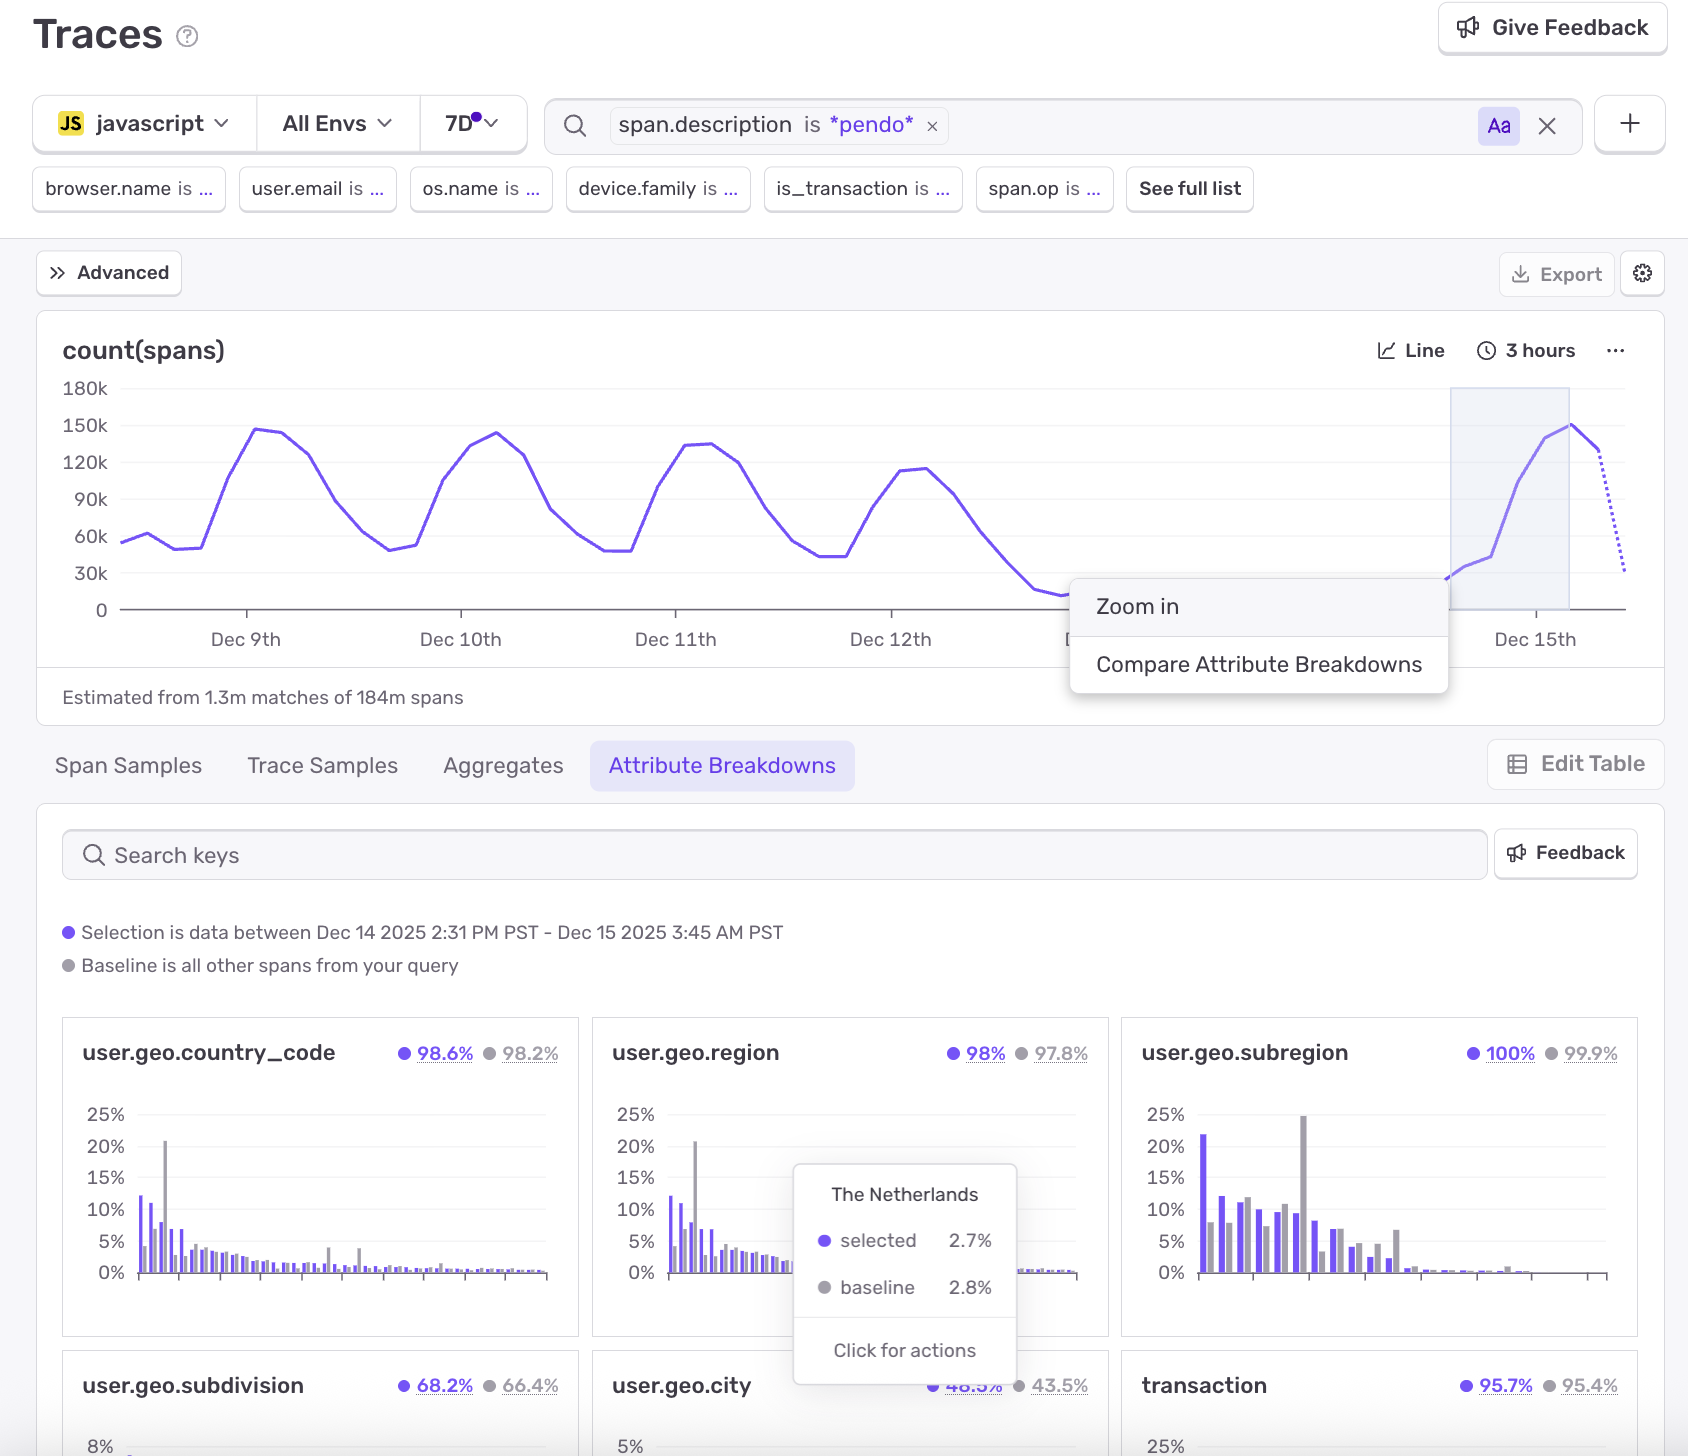
Attribute Breakdown helps you quickly answer “what changed?” by comparing a selected time window against baseline traffic — without iterating on multiple group-bys.
Select a time range in a chart and Sentry compares spans in that window to normal traffic, surfacing attribute values that are over-represented relative to the baseline.
With Attribute Breakdown, you can do things like:
- Identify which span attributes are driving an increase in errored or slow spans.
- See which span ops, services, or regions are disproportionately represented during a regression.
- Compare spans during a spike to baseline to understand what changed.
How it works: When you select a time range, Sentry automatically compares spans inside that window to spans outside it. It analyzes span attributes and highlights values that contribute disproportionately to the selected period, helping you identify likely causes without manually slicing the data across attributes.