monday.com is a cloud-based collaboration platform with more than 1.2M monthly users and more than 1M collaborative actions per hour, allowing teams from more than 152k organizations like Hulu, Adobe, Canva and Coca-Cola to create their own applications and work management software.
“Sentry supports all the platforms in our stack and allows easy correlation between them. They excel at all aspects of error tracking, and moreover, provide our teams the ability to customize everything tofullstack fit our changing needs, which is exactly what we were looking for.”
Roni Avidov, R&D Team Lead, monday.com
Tuning out the noise
monday.com ships new features and updates daily through 8 automatic deployments running at the top of every hour and engineers are regularly pushing new code. All of this activity coupled with monitoring tools that lacked advanced grouping functionality created alert fatigue, volumes of false-negatives, and an overall lack of trust in the team’s existing monitoring tools.
Initially they relied on separate, internal tools for front and backend monitoring, making for a noisy, labor-intensive environment that hurt developer productivity and impacted the performance and usability of their platform.
“As we set out to improve error tracking, our error monitoring stack was based on SaaS we already used and a few internal products we created to tailor this service to our requirements.”
Solving for increasingly distributed architecture
monday.com runs more than 10 Node.js. microservices, with a Ruby on Rails monolith, MySQL datastores, Redis and Memcached services, all hosted on AWS with Kubernetes. In addition to supporting these languages and frameworks, the team had a few key requirements they needed met when looking at new vendors.
First off, they needed a solution that would allow them to jump between services seamlessly, allowing them to continue growing as their architecture becomes more distributed and more services are added to each flow. The goal was to keep the error tracking process simple, and to have visibility into the entire flow for each error in one place.
Here’s how:
With more than 150 engineers and automatic deployments running every hour, the team also needed a tool that could help them manage releases to quickly see how a release is performing, the engineers involved, and any relevant errors. Finally, with the goal of reducing false-negatives, they wanted a solution that would allow them to customize the grouping of errors for better identification of new issues, and one that automatically assigned teams to the right issue with support for their existing CODEOWNERS file to help reduce noise and accelerate issue triage.
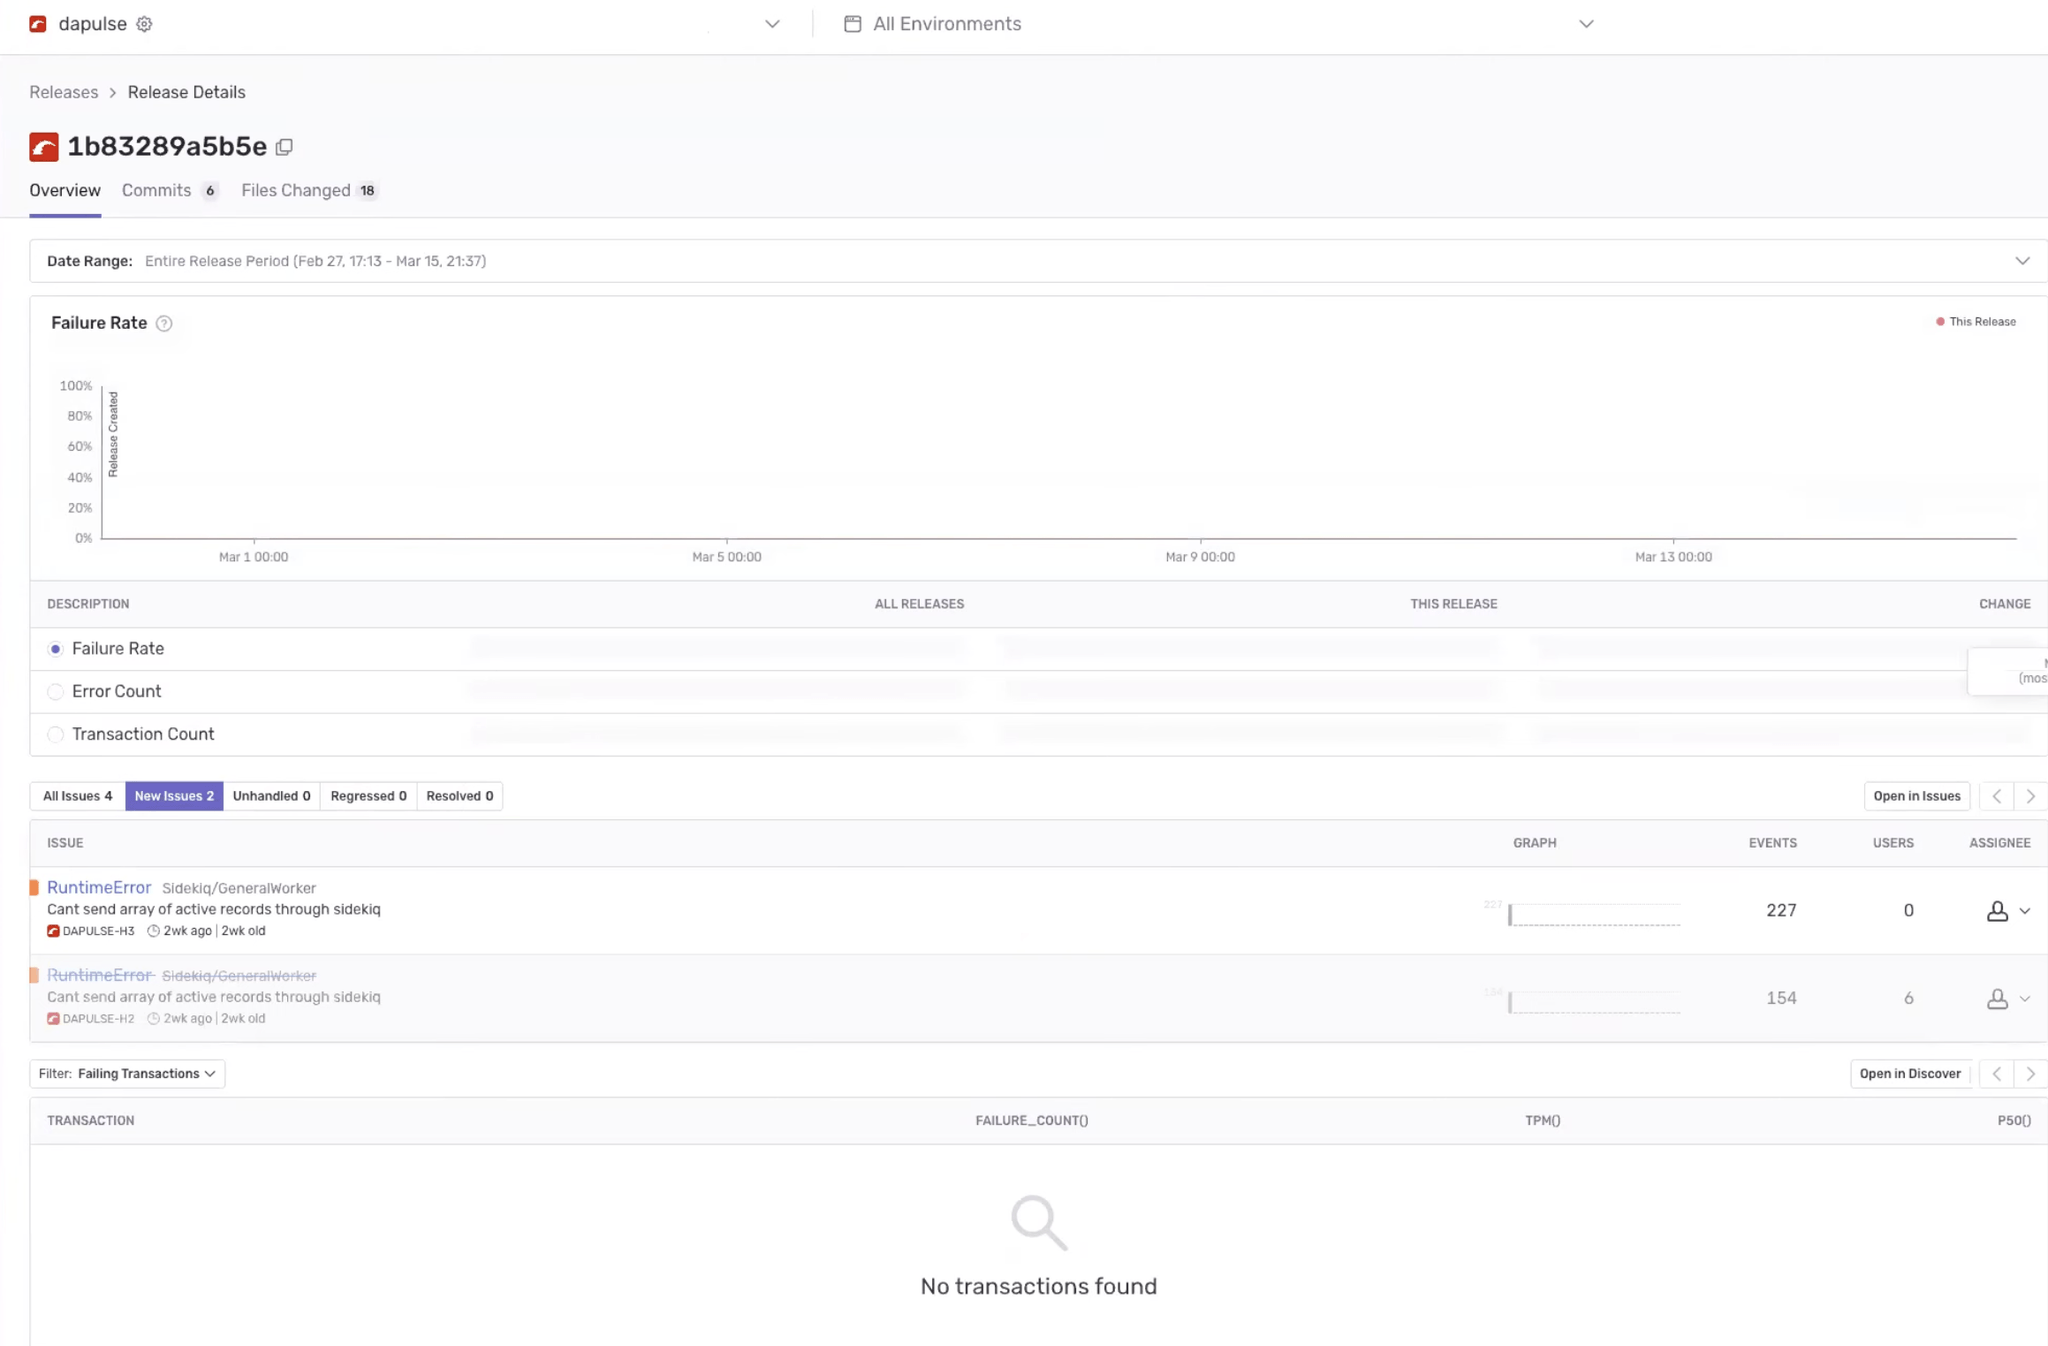
Managing releases with Sentry
“Monitoring a production environment is always a challenge, with regular deployments, third party integrations, and the cloud resources we depend on - the number of issues that can fire from any one system increases the complexity of figuring out which service or team owns what. Because of this, it is important to stay one step ahead to provide the quality we demand for our users.”
Making Sentry their own
With these requirements in mind, monday.com partnered with Sentry knowing that they would have a solution that supports all the platforms in their stack, allows for easy correlation between them and provides the option to customize as their parameters evolved.
As the team started using Sentry they were soon able to enrich errors with distinctive identifiers unique to monday.com, helping them better understand the scope and impact of each error and respond to them faster and more effectively. Here’s how:
With breadcrumbs they can see a timeline of the actions that led to an error, reducing the time required to resolve it; but monday.com took this a step further and added their own custom events, allowing for more granular investigations.
Here’s what it looks like:
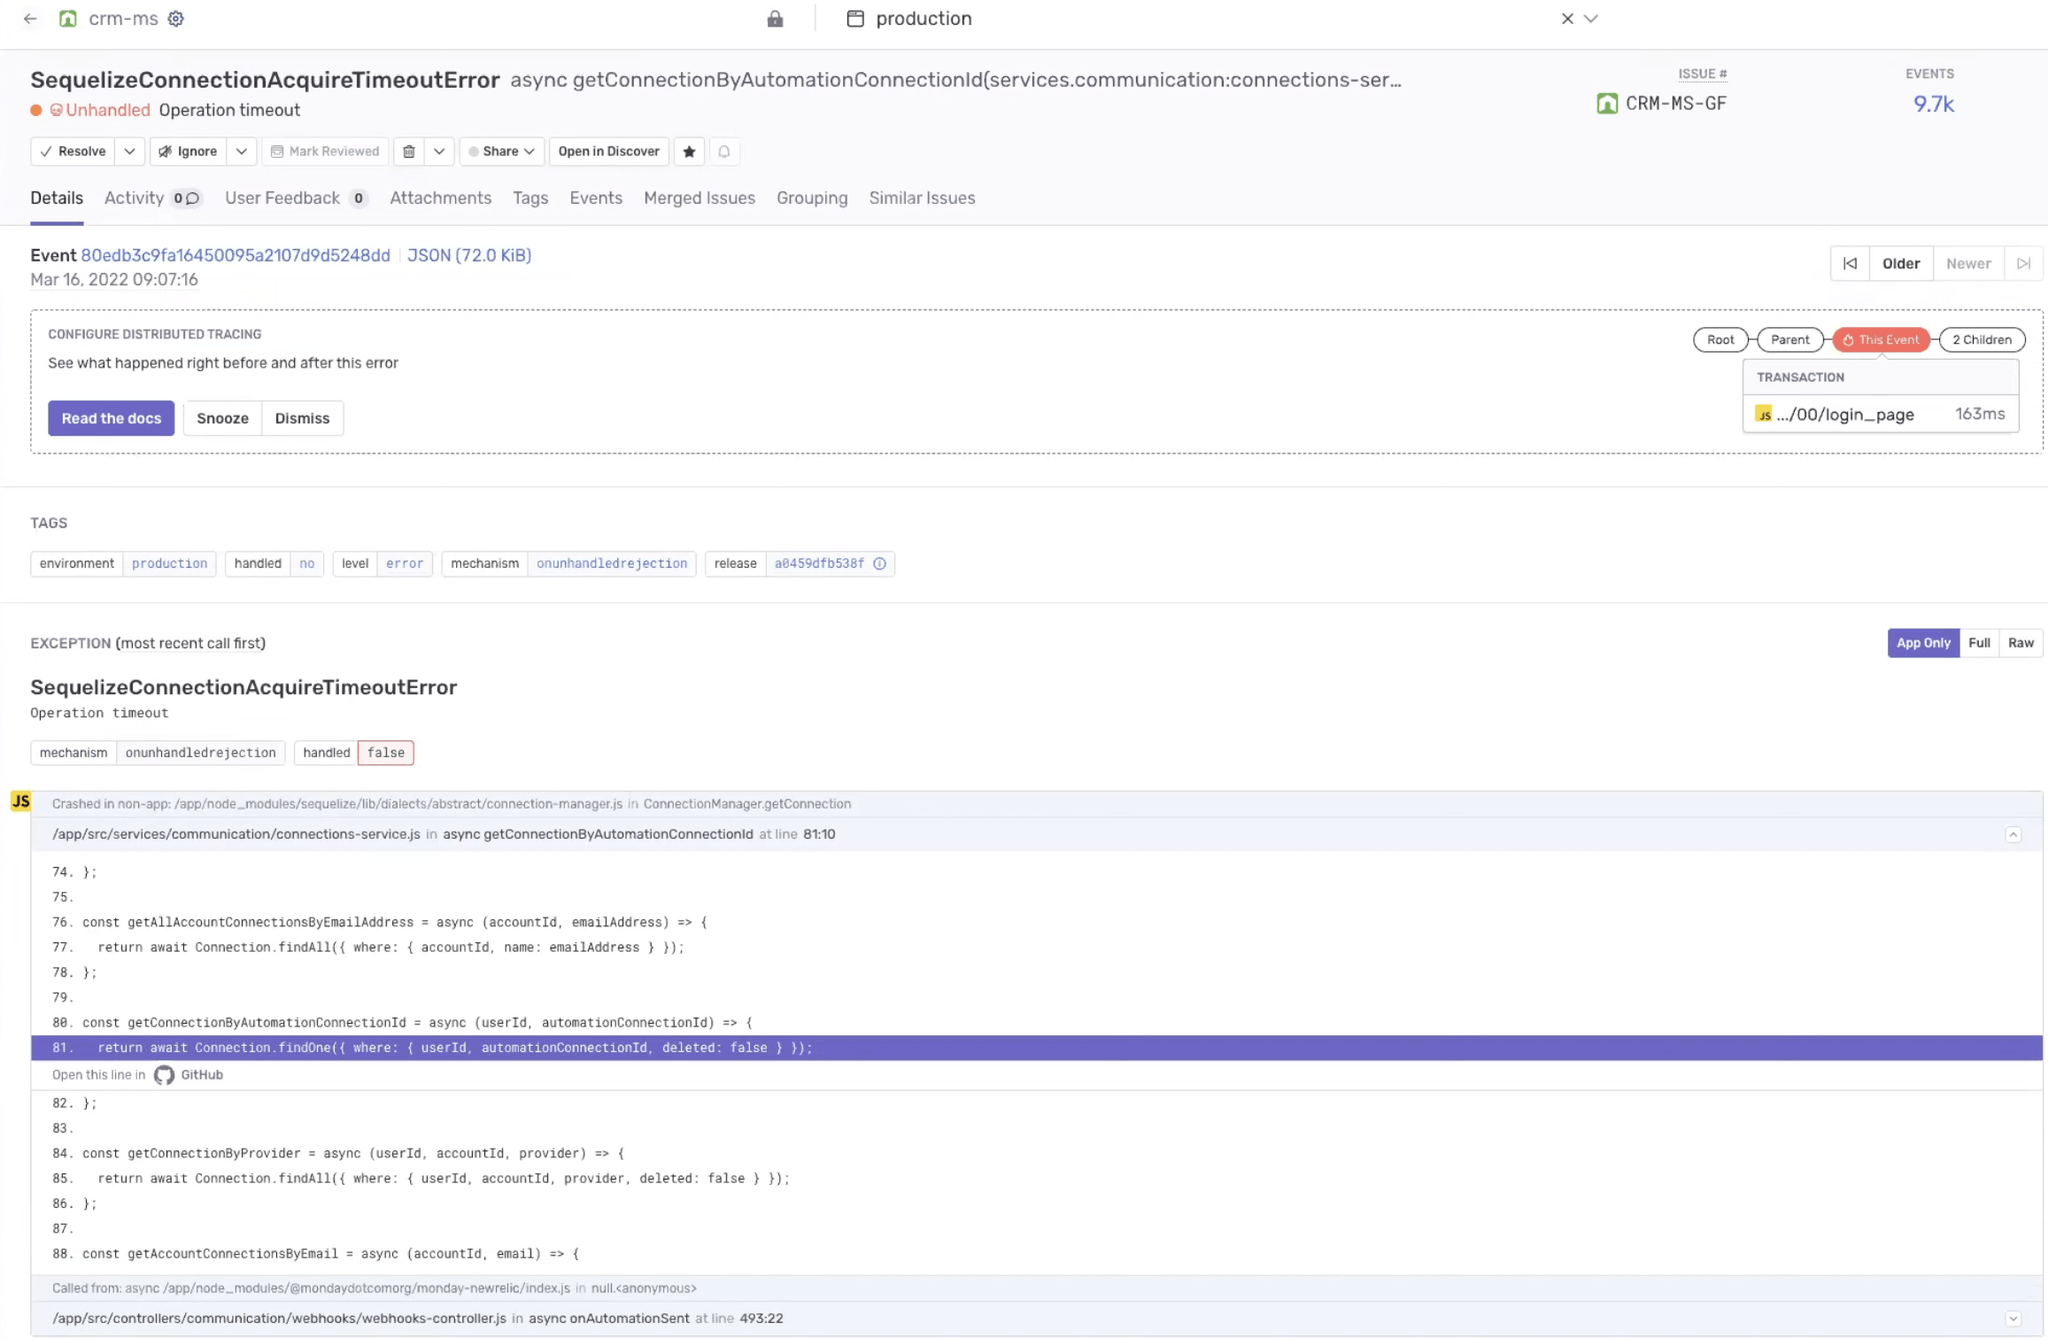
Custom events with breadcrumbs
“Using the breadcrumbs, tags, and integration between releases we’ve improved time to resolution from 30-45 minutes to 10 minutes. Think about our 150+ developers and multiply that by the number of issues we see across our services and clients - it’s insane the amount of developer time we’ve saved.”
They’ve also configured Metric alerts to generate a notification as soon as new issues surface, essentially giving the team a real-time pulse on what’s going on. Adjusting the threshold on alerts, they’re also able to filter them so only high-impact alerts trigger notifications, whereafter they’re quickly assigned to the relevant team.
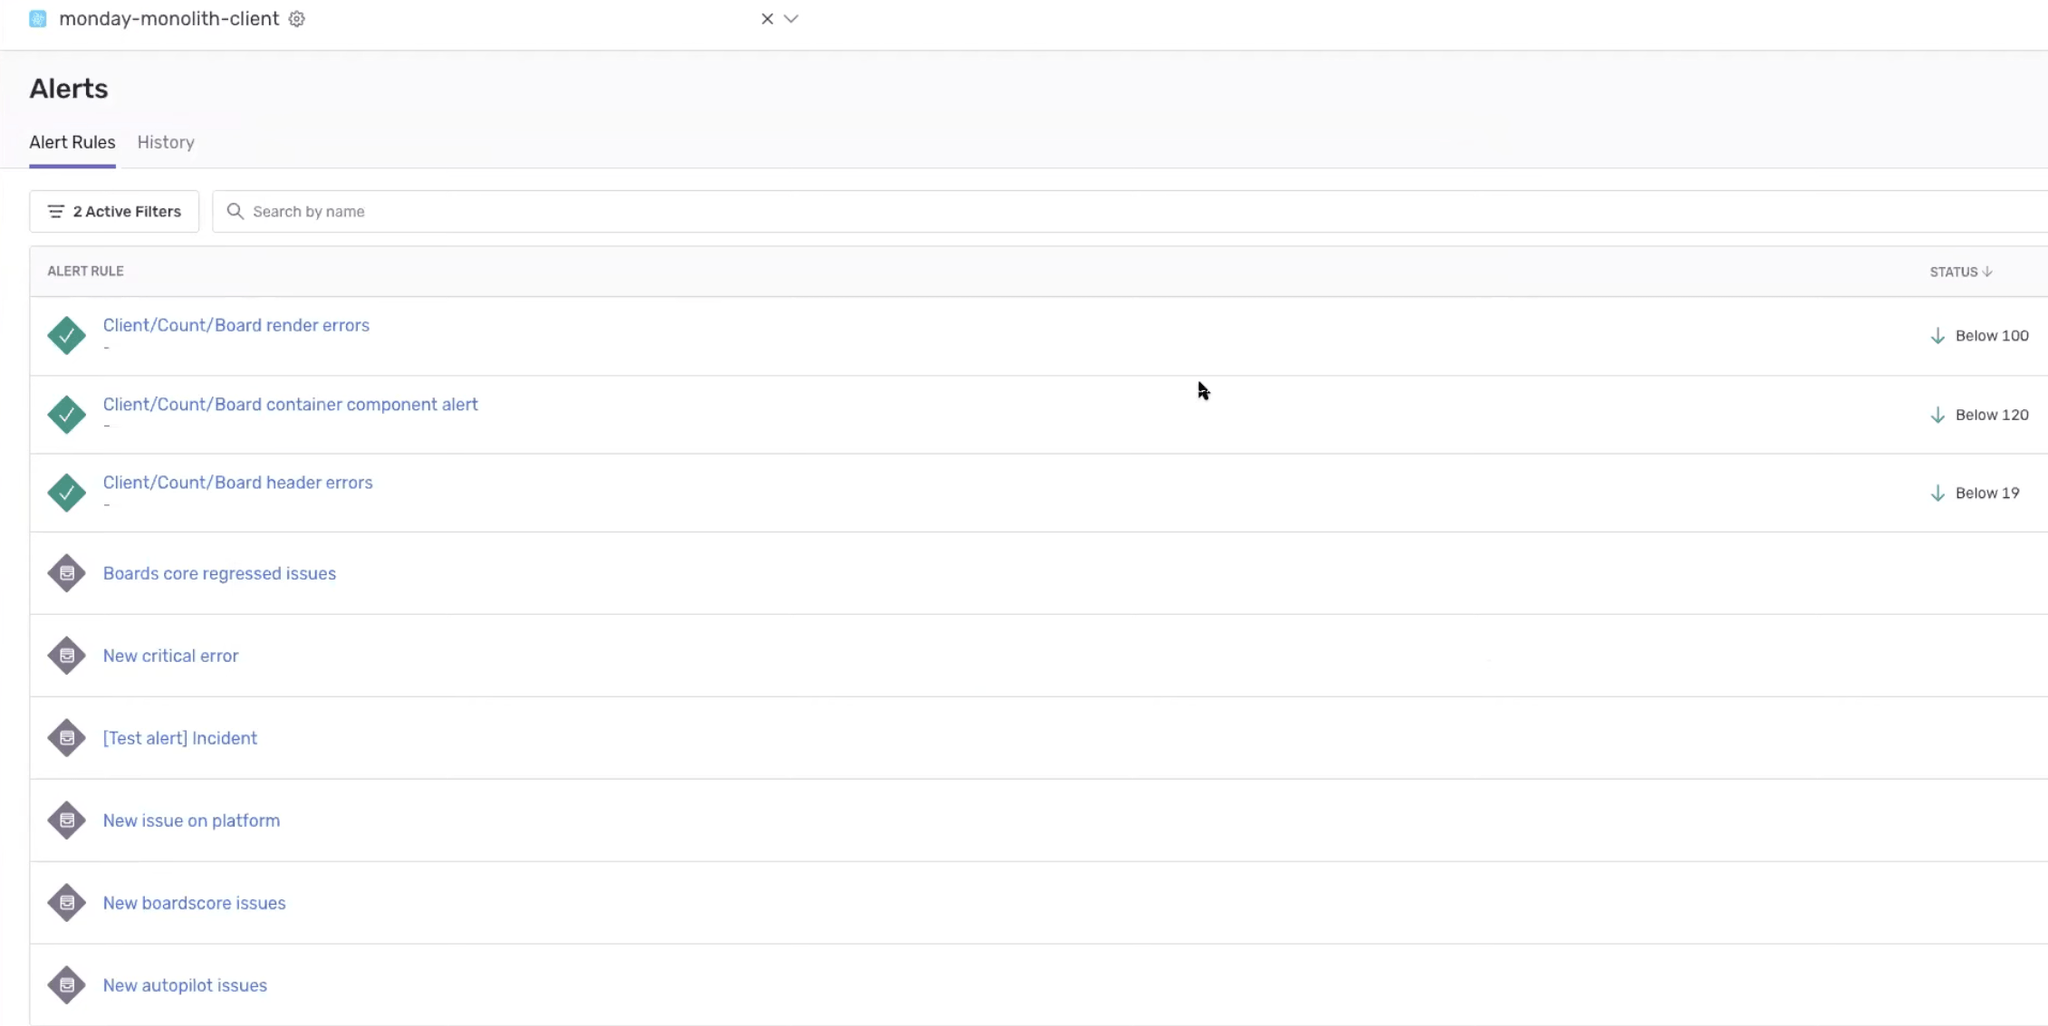
Metric alerts
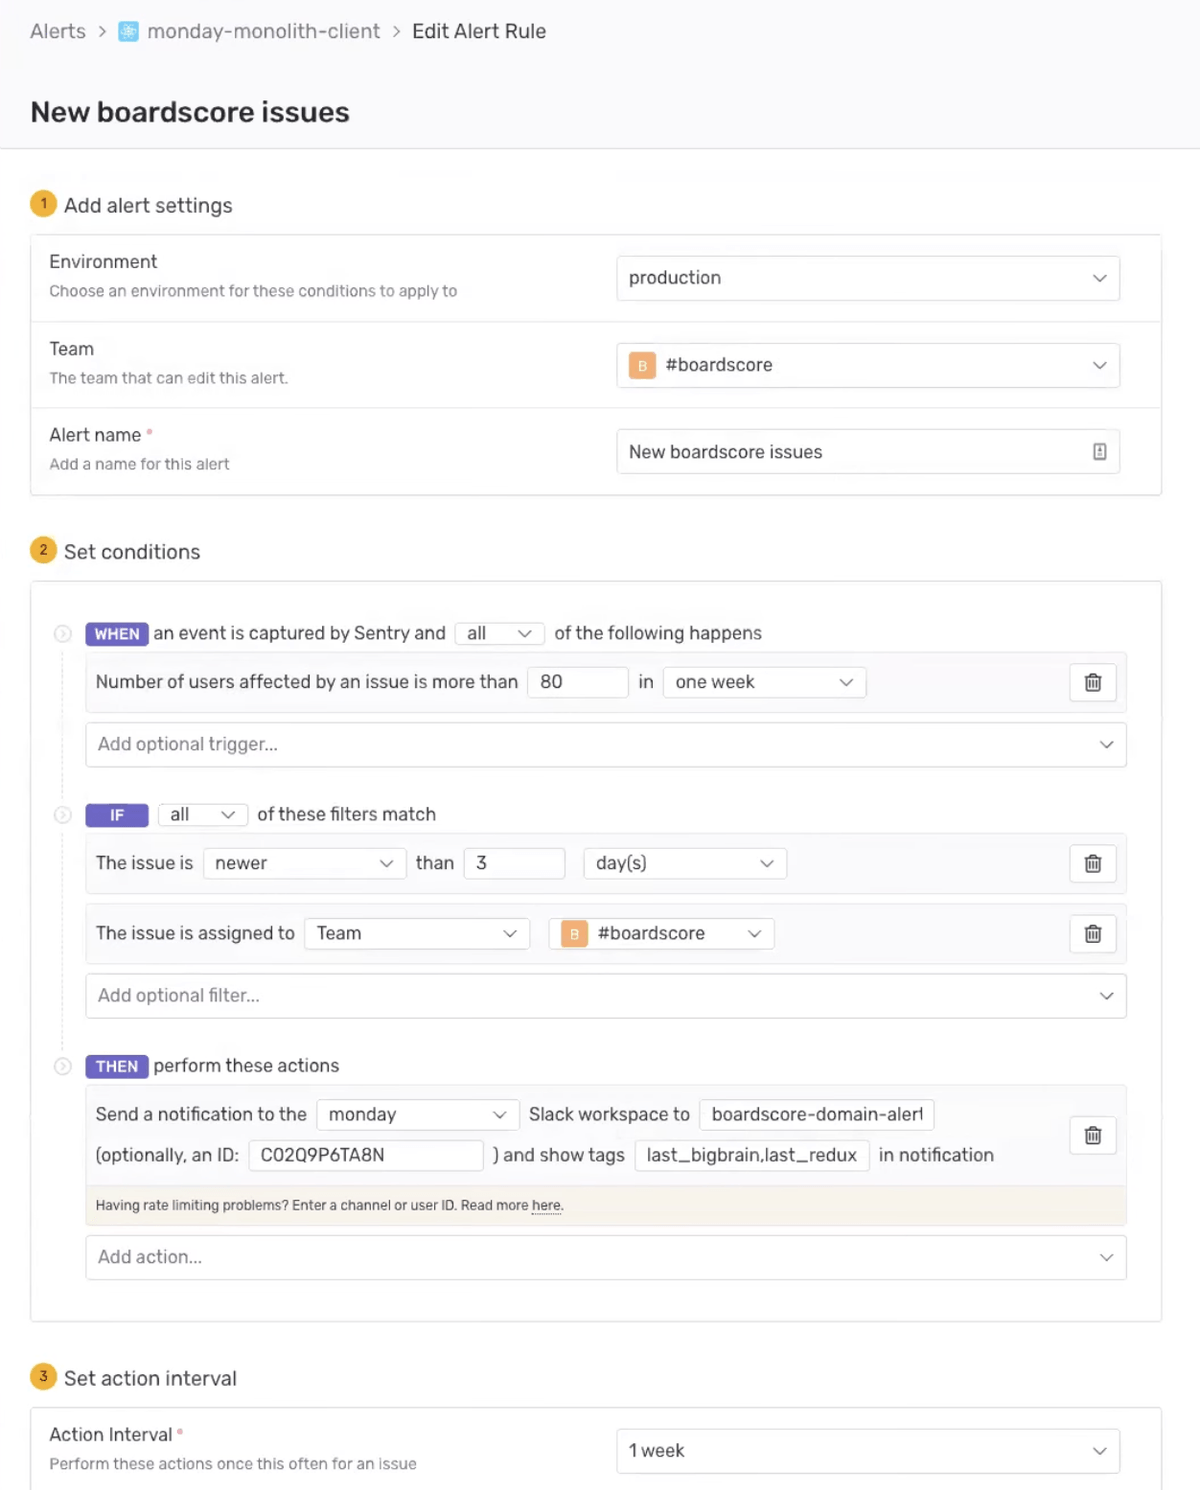
Customizing metric alerts
Optimizing error tracking
The analytics events that monday.com uses to measure how users interact with their system are invaluable. Leveraging Sentry, they now have an event for every interaction, and by embedding those events into their error timeline, they have the full history of exactly what happened leading up to it.
“The more complex our system becomes, with more microservices, routes, and integrations, the more important it is to correlate between sessions,” says Roni, adding that “Even if each request worked well on its own, when things get to production, the integration of services has the potential for problems.”
monday.com implements their front end using React and Redux, and with Sentry they’re able to use Redux actions to further enrich errors with additional tags, showing the last redux event fired before the action. This has helped them identify whether an error is related to a specific Redux action, subsequently allowing them to fix it on the spot.
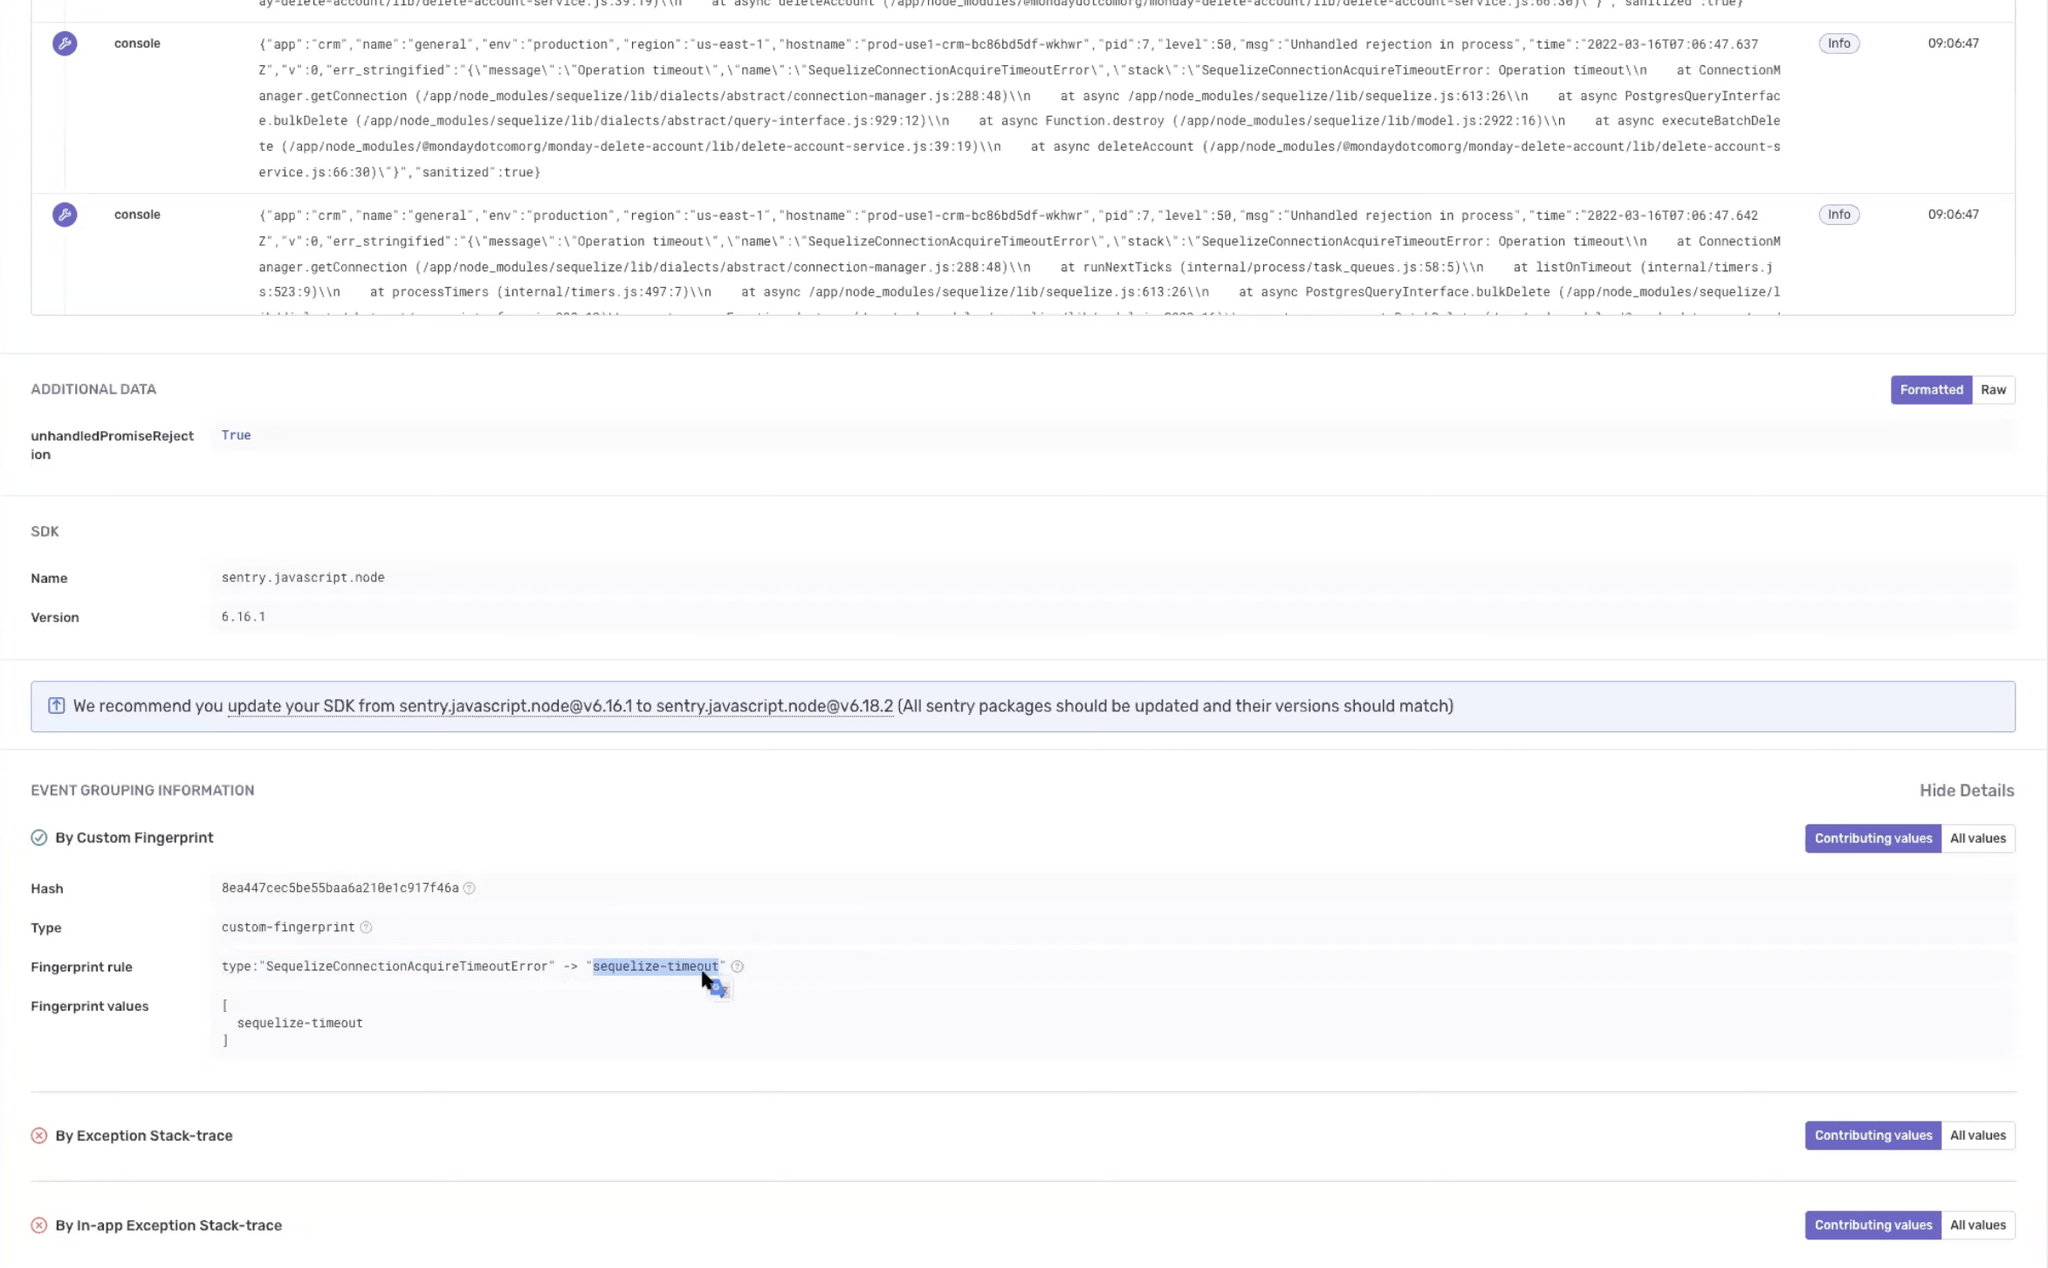
The team also integrated their custom React error Component with Sentry, allowing them to enrich every event of that “ErrorComponent” with the stack trace and original component that caused the error; equipping them with a dashboard where they’re able to aggregate and keep an eye on any uncaught errors and prioritize them accordingly.
Sentry’s auto-correlation of client and server errors was a deciding factor for monday.com. With client and server running Sentry, their team is able to jump between a client error and the specific server error that caused it without any extra effort.
“Our previous error monitoring tool mostly covered high severity issues and there was no good solution for small regressions. By integrating Sentry into our client, the visibility we got into what our users were experiencing allowed us to reduce client-side errors by more than 60%.”
Accelerating time to resolution
To tie things up, monday.com uses spike alerts that quickly detect any drastic increase in the volume of errors, reducing the time it takes to detect a malfunctioning critical component. Alerts are then used to ensure errors are handled in the right order of priority and assigned to the relevant teams.
From error tracking to release health and ultimately response, monday.com has gone all-in with Sentry and taken advantage of a solution that allows teams to work effectively and efficiently without being held back by inflexible technology. In doing so, they’ve personalized their Sentry experience to adapt to their unique business requirements, allowing them to reduce “noise,” engineer fatigue, and craft a streamlined process from start to finish.
“Prior to Sentry we were in a state where we were working for the alerts and now the alerts are working for us. We reduced false alerts by more than 50% by fine tuning the thresholds and defining the criteria that works best for us with Sentry alerts-it’s a completely new world for monday.com.”

