
Ruby Error and Performance Monitoring
Actionable insights to resolve Ruby performance bottlenecks and errors. Improve your Ruby monitoring workflow with a full view of releases so you can mark errors as resolved and prioritize live issues.
How to install the Ruby SDK
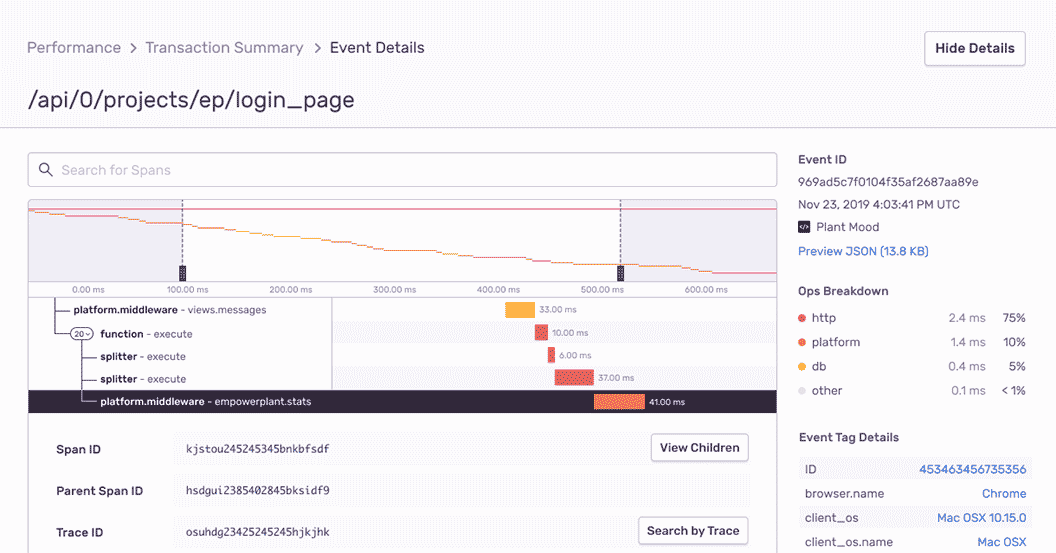
Ruby Performance Monitoring
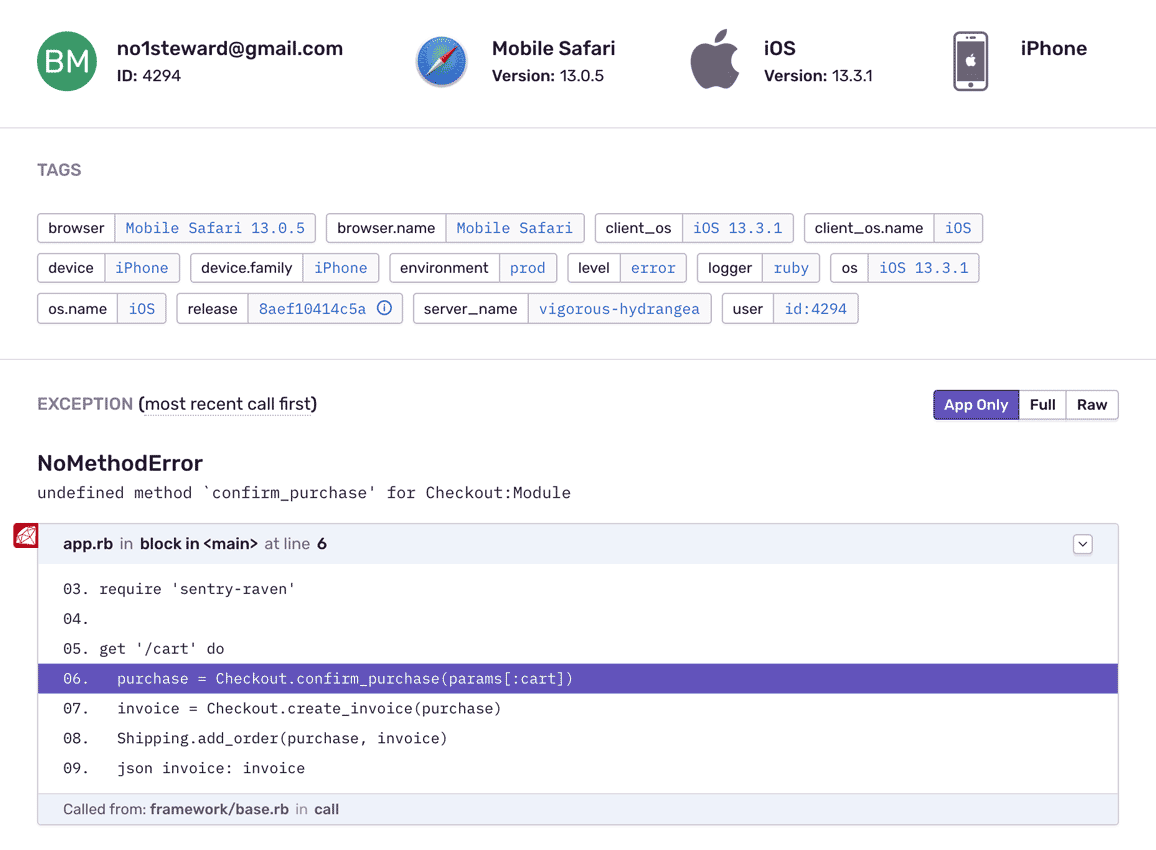
Ruby Monitoring with Complete Stack Traces
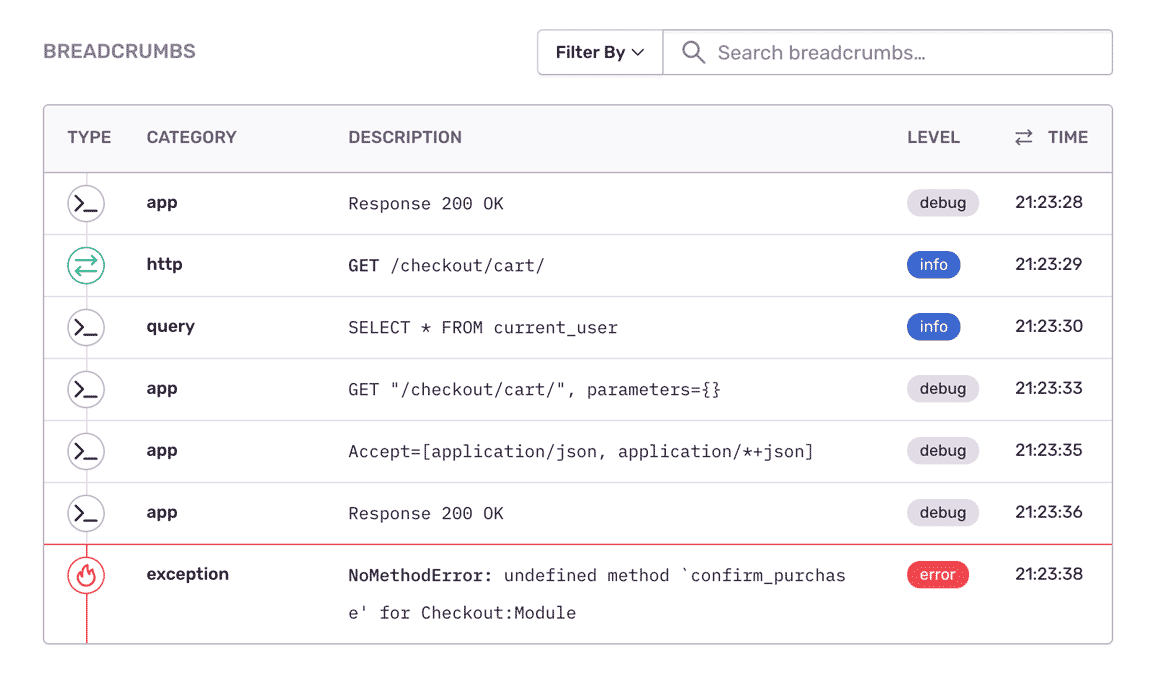
Fill In The Blanks About Ruby Errors
"Sentry has become mission-critical to the way we build and ship software."
See the Full Picture of Any Ruby Exception
Get the user's unique id, contact info, and IP address, as well as any localization as context to resolve the error and notify your customer.
Index and aggregate tags to easily search your error reports, see the distribution of issues, and find what's a priority or a trend.
Find answers to key questions: Is the Ruby exception limited to a single server? What arguments caused the ActiveJob to fail?
It's why companies that don't have a complete view of their infrastructure are being punished:
The average cost of network downtime is around $5,600 per minute — or $300,000 per hour.
1 out of 5 online shoppers will abandon their cart because the transaction process was too slow.
On average, a two-second slowdown in page load decreases revenues by 4.3 percent.
FAQs
Sentry supports every major language, framework, and library. You can browse each of them here.
You can get started for free. Pricing depends on the number of monthly events, transactions, and attachments that you send Sentry. For more details, visit our pricing page.
Sentry doesn't impact a web site's performance.
If you look at the configuration options for when you initialize Sentry in your code, you'll see there's nothing regarding minimizing its impact on your app's performance. This is because our team of SDK engineers already developed Sentry with this in mind.
Sentry is a listener/handler for errors that asynchronously sends out the error/event to Sentry.io. This is non-blocking. The error/event only goes out if this is an error.
Global handlers have almost no impact as well, as they are native APIs provided by the browsers.