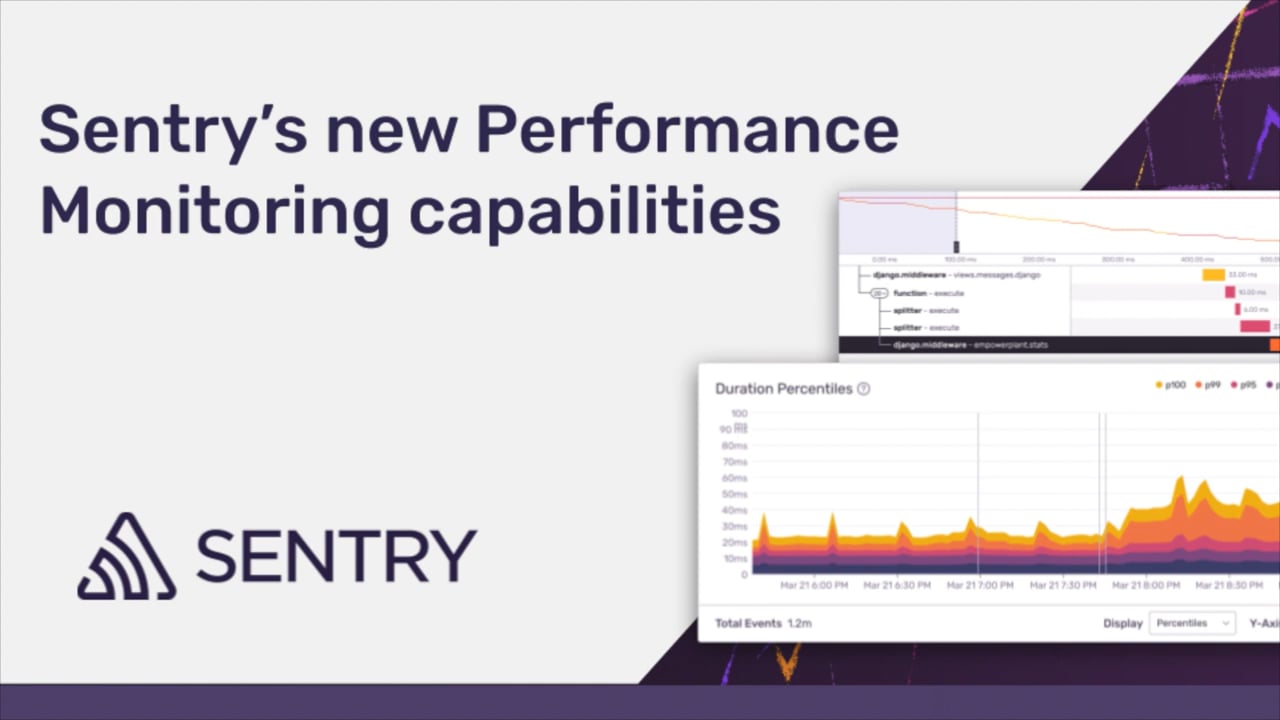
Sentry's new Performance Monitoring capabilities
Neil Manvar (Solutions Engineering Manager at Sentry) walks you through how to get the most out Sentry’s new Application Performance Monitoring capabilities.
You’ll learn how to:
- Integrate and configure the SDK to send transactions in addition to errors/events
- Use Sentry to trace through services (for instance, frontend to backend) to identify poor-performing code
- Use Discover to query transaction data
- Create alerts and get notified when critical slowdowns are introduced
- Get a sneak peek at how Sentry uses Sentry
0:12 – Sentry Application Monitoring (5 pillars) 3:01 – Sentry Performance (& the problems we help solve) 5:02 – Getting started with Performance 8:55 – Performance Monitoring Demo (debugging slowdowns in JS + Python) 18:52 – Alerting and Querying Performance issues 27:58 – How Sentry uses Sentry 33:49 – Q & A
Listen to the Syntax Podcast
Of course we sponsor a developer podcast. Check it out on your favorite listening platform.