
Debug faster with OpenTelemetry data in Sentry
Resolve code issues faster by adding your OpenTelemetry traces and logs to Sentry. Connect with the community on Discord.
How it works
Leverage the OpenTelemetry instrumentation you're already using and plug it into Sentry via the SDK. Get to the root of a problem with detailed distributed traces that provide a complete end-to-end view of the request path leading up to an error; and let Sentry automatically categorize performance issues based on your stack.
More than 150K Organizations Trust Sentry with Their Application Monitoring
What you can do with Sentry and OpenTelemetry
See the full story behind every error
- View the full sequence of events leading up to each error—including SQL queries, network requests, and debug logs
- Search through structured logs with automatic trace correlation—no more grepping through files
Trace issues across your entire stack
- Get a unified view from frontend to backend in a single trace
- Find root causes faster by following slow-loading pages all the way back to poor-performing API calls, and surface any related errors
Monitor traces and get alerted on important changes
- Get notified on what matters to you, like when endpoint latency exceeds acceptable thresholds or regresses from baseline
- Filter down to the most important traces based on attributes like endpoint, method, or status code
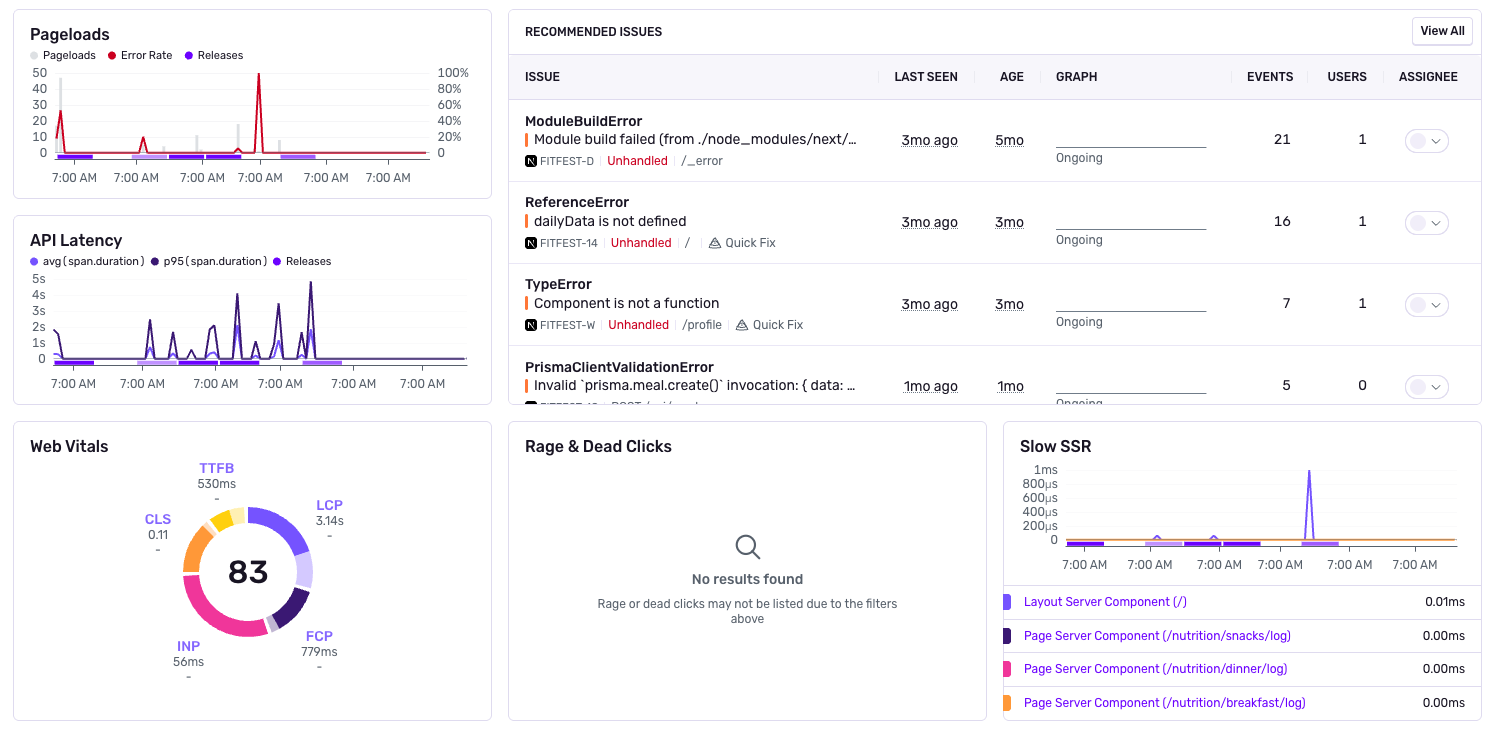
- Review insights for backend performance and errors, and create custom dashboards
"Getting started with Sentry and OpenTelemetry was fast and easy. We chose Sentry because we can understand why and where something is slow, fix it quickly, and get ahead of user complaints."
FAQs
The collector approach ultimately removes the Sentry SDKs from the equation, which means you will not get the benefits of advanced error tracking, or any other features Sentry SDKs provide. That includes new product features like profiling and crons. So the approach we decided upon was to treat OTel the same way we treat any other framework. The SDKs can plugin and capture all the relevant data to send to Sentry where we can couple it with all the other features, while getting all insights from your OTel data.
The parent-most OTel span on the OTel span tree that's created becomes the transaction, and the rest of the spans on the OTel span tree (descendants, branches/leaves) are the spans inside of it.
Yes. Our goal is a flawless conversion of OTel data into Sentry. We do not do some things like automatically set tags. But if you see something amiss, reach out to support, or create an issue for SDK team on one of our repos, we will make sure it is routed to the right place.
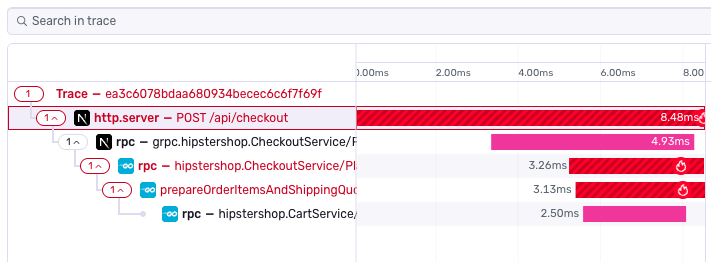
A trace represents the record of the entire operation you want to measure or track - like page load, an instance of a user completing some action in your application, or a cron job in your backend. When a trace includes work in multiple services, such as those listed above, it's called a distributed trace, because the trace is distributed across those services.
Each trace consists of one or more tree-like structures called spans, a named, timed operation that represents a part of the application workflow. The data captured for each span provides granular insights into specific tasks, like API requests or database queries. Learn more about distributed tracing.
Looking for an example suite of microservices already instrumented with Sentry and OTel SDKs? We got you covered. Check out our demo repo in Github here. This is a fork of the official example provided by OpenTelemetry we use for our own testing purposed.