Metrics Quickstart
Send counters, gauges, and distributions from your code to track things like email.sent, checkout.failed, or queue.depth, and pivot directly into related traces, logs, and errors when something looks off.
2Setup
Initialize your Sentry SDK with your DSN to start sending metrics. Metrics are automatically enabled in SDK versions 10.25.0 and above.
The code snippet shows the basic initialization required to enable Metrics in your application.
Learn more about Metricsimport * as Sentry from "@sentry/nextjs"; Sentry.init({ dsn: "https://examplePublicKey@o0.ingest.sentry.io/0", // that's it - metrics are enabled by default! });
3Configure
Metric Types
Sentry supports three metric types: Counters for tracking incrementing values (e.g., email.sent, checkout.failed), Gauges for values that go up and down (e.g., queue.depth), and Distributions for tracking value distributions (e.g., response.time).
Learn more about metric typesimport * as Sentry from "@sentry/nextjs"; // Counter — track an incrementing value Sentry.metrics.count('email.sent', 1); // Counter — track failures Sentry.metrics.count('checkout.failed', 1); // Gauge — track a value that can go up and down Sentry.metrics.gauge('queue.depth', 42); // Distribution — track the distribution of a value Sentry.metrics.distribution('response.time', 187.5);
Attributes
Add custom attributes to metrics for filtering and grouping. You can define your own dimensions like browser, app_version, page, and so on, to slice your metrics data in the dashboard. Every metric automatically includes environment, release, and SDK information as default attributes.
Learn more about attributesSentry.metrics.count('button_click', 1, { attributes: { browser: 'Firefox', app_version: '1.0.0', }, });
4See It In Action
View Metrics in the Explore Tab
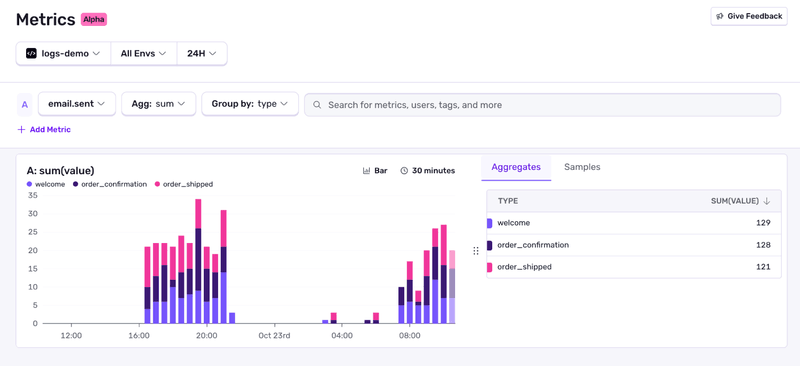
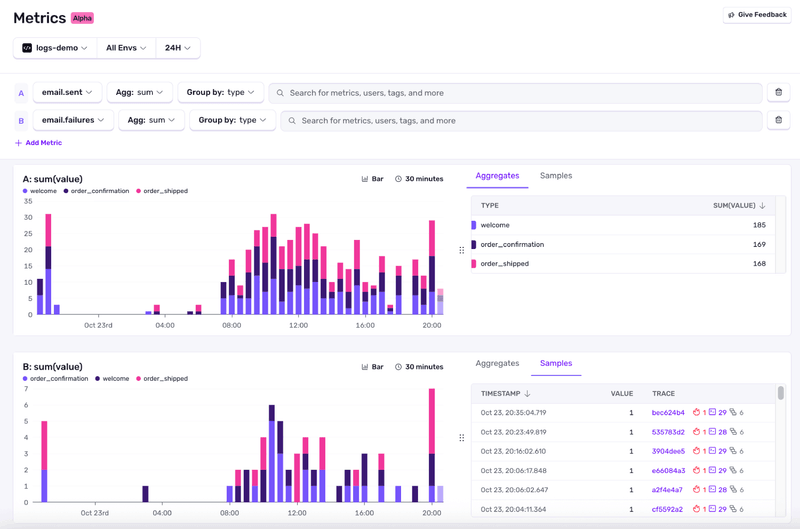
After sending metrics, go to Explore > Metrics to see your data. The Aggregates tab shows trends and totals across any attributes (e.g., sum(metrics_value) grouped by email_type). The Samples tab shows individual metric events with direct links to their trace - so you can jump straight into the logs, spans, and errors that occurred at the same moment.
Learn more about viewing metrics
Pivot from Metrics to Traces
When a metric spikes or dips, click into a sample to see the exact trace that produced it. Open the related spans, logs, and errors to understand why the metric moved - slow database query, failed API call, bad deploy, etc. Debugging becomes a single flow: Metric spike → open a sample → trace waterfall → root cause.
Learn more about metrics debugging flow
Next Steps
Explore the full documentation to learn more about Metrics features, use cases, and best practices.