Frontend Monitoring

Your code is telling you more than what your logs let on. Sentry's frontend monitoring gives you full visibility into your code, so you can catch issues before they become downtime.

Getting Started is Simple

Grab the Sentry JavaScript SDK:

Copied!Click to Copy
<script src="https://browser.sentry-cdn.com/latest/bundle.min.js"></script>

Configure your DSN:

Copied!Click to Copy
Sentry.init({
  dsn: 'https://<key>@sentry.io/<project>',
  integrations: [Sentry.browserTracingIntegration()],
  tracesSampleRate: 1.0,
  tracePropagationTargets: ['localhost', /^\/https:\/\/yourserver\.io\/api/],
});

Grab the Sentry React SDK:

Copied!Click to Copy
npm install @sentry/react

We recommend putting the Sentry initialization code into its own file and including that file as the first import in your application entry point as shown in the example below:

Copied!Click to Copy
import { useEffect } from "react";
import * as Sentry from "@sentry/react";

Sentry.init({
  dsn: "https://examplePublicKey@o0.ingest.sentry.io/0",
  integrations: [
  ],
  // Set `tracePropagationTargets` to control for which URLs trace propagation should be enabled
  tracePropagationTargets: [/^\//, /^https:\/\/yourserver\.io\/api/],
});

Include the Sentry initialization file as the first import statement:

Copied!Click to Copy
// Sentry initialization should be imported first!
import "./instrument";
import App from "./App";
import { createRoot } from "react-dom/client";

const container = document.getElementById(“app”);
const root = createRoot(container);
root.render(<App />);

Install with one line of code:

Copied!Click to Copy
npx @sentry/wizard@latest -i angular
Copied!Click to Copy
<script src="https://browser.sentry-cdn.com/10.47.0/bundle.min.js"></script>

Configure your DSN:

Copied!Click to Copy
Sentry.init({
  dsn: 'https://<key>@sentry.io/<project>',
  integrations: [new Sentry.Integrations.Ember()]
});

Just run this command to install the Sentry Vue SDK:

Copied!Click to Copy
npm install @sentry/vue

Configure your DSN:

Copied!Click to Copy
import { createApp } from "vue";
import * as Sentry from "@sentry/vue";

const app = createApp({
  // ...
});

Sentry.init({
  app,
  dsn: "https://<key>@sentry.io/<project>",
  integrations: [Sentry.browserTracingIntegration()],

  // We recommend adjusting this value in production, or using tracesSampler
  // for finer control
  tracesSampleRate: 1.0,
  // Set tracePropagationTargets to control for which URLs distributed tracing should be enabled
  tracePropagationTargets: ['localhost', /^https:\/\/yourserver\.io\/api/],
});

app.mount("#app");

See -- it's really just one command.

Copied!Click to Copy
npx @sentry/wizard@latest -i nextjs

More than 150K Organizations Trust Sentry with Their Application Monitoring

Breadcrumbs showing an error trail

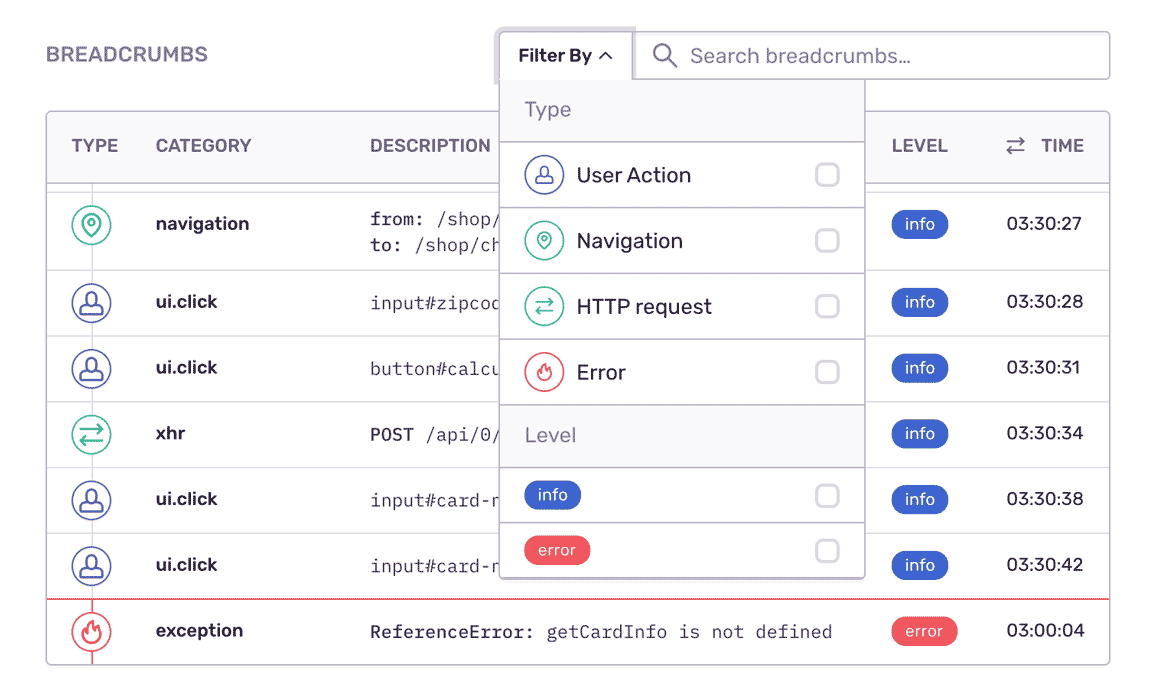
Trace an error's trail.
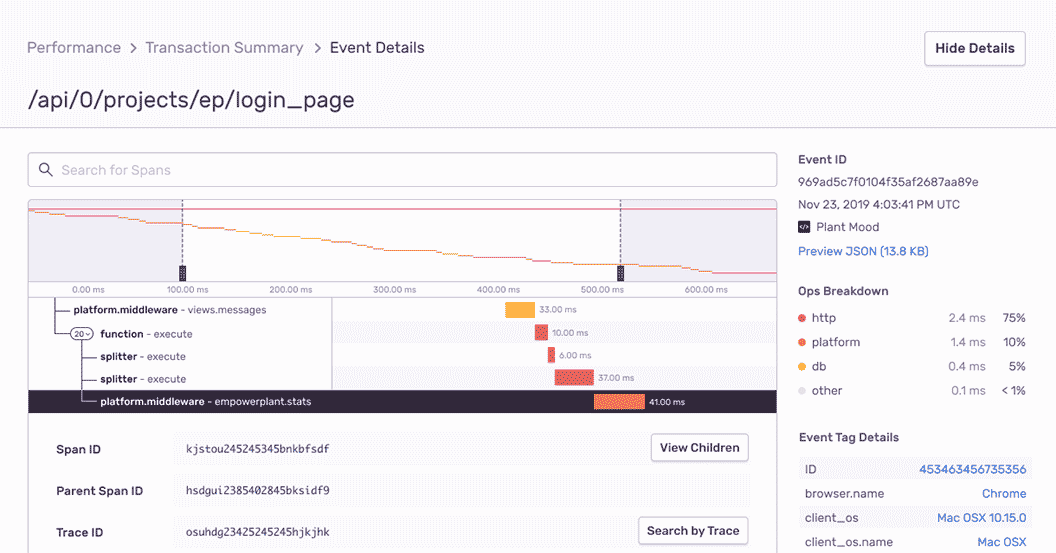
Sentry's frontend monitoring lets you see how an error progresses through your stack. With it, you can trace most interaction events, from clicks and inputs to page navigation and console messages — even events that preceded the errors.
Performance waterfall showing distributed trace

Constant context.

Frontend monitoring records all HTTP requests and user-initiated responses. Now you can view a distributed trace end-to-end, all so you can see the exact, poor-performing API call — and surface any related errors.
Release view showing issue prioritization

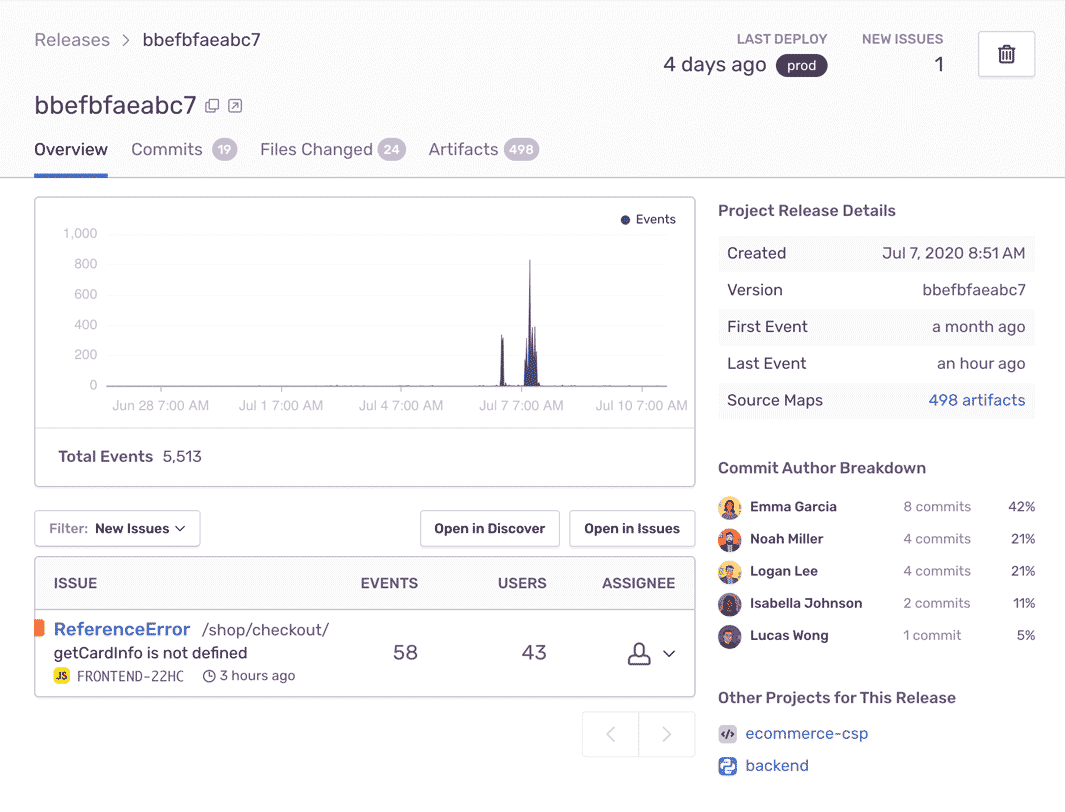
Maximum efficiency. Minimal effort.

By giving you a full view of releases, frontend monitoring can help you prioritize issues in real time — things like learning in which version did a bug first appear, and whether things will regress in a future release.

"Sentry's high-quality tooling helps Disney+ maintain high-quality service to its tens of millions of global subscribers."

Andrew Hay
Director of Engineering at Disney Streaming Services

You can't afford to put frontend monitoring on the backburner.

Even a one-second delay in loading results in a 7% reduction in conversions.

Forty percent of customers abandon a website that takes longer than three seconds to load.

The average cost of downtime is $5,600 per minute — or $300,000 per hour.

FAQs

Traditional logging provides you with a trail of events. Some of those events are errors, but many times they're simply informational. Sentry is fundamentally different because we focus on exceptions, or in other words, we capture application crashes. We discuss in more detail here and on our blog.

Sentry supports every major frontend language, framework, and library. You can browse each of them here.

You can get started for free. Pricing depends on the number of monthly events, transactions, and attachments that you send Sentry. For more details, visit our pricing page.

Sentry doesn't impact a web site's performance.

If you look at the configuration options for when you initialize Sentry in your code, you'll see there's nothing regarding minimizing its impact on your app's performance. This is because our team of SDK engineers already developed Sentry with this in mind.

Sentry is a listener/handler for errors that asynchronously sends out the error/event to Sentry.io. This is non-blocking. The error/event only goes out if this is an error.

Global handlers have almost no impact as well, as they are native APIs provided by the browsers.

A better experience for your users. An easier life for your developers.