Sentry for Cloud Functions for Firebase

Using Sentry with Cloud Functions for Firebase makes debugging as painless as possible, so you can keep everything up and running.

Getting Started is Simple

Add @sentry/node as a dependency:

Copied!Click to Copy
npm install --save @sentry/node

Create an initialization file (e.g., init.ts) that runs before your functions:

Copied!Click to Copy
import * as Sentry from '@sentry/node';

Sentry.init({
  dsn: 'https://<key>@sentry.io/<project>',
  tracesSampleRate: 1.0,
});

Import the initialization file at the top of your functions entry point:

Copied!Click to Copy
import './init'; // Import Sentry initialization first

import { onRequest } from 'firebase-functions/https';
import { onDocumentCreated } from 'firebase-functions/firestore';
import * as admin from 'firebase-admin';

admin.initializeApp();
const db = admin.firestore();

// HTTP function - automatically instrumented
export const helloWorld = onRequest(async (request, response) => {
  response.send('Hello from Firebase!');
});

// Firestore trigger - automatically instrumented
export const onUserCreated = onDocumentCreated('users/{userId}', async (event) => {
  const userId = event.params.userId;
  // Your logic here
});

More than 150K Organizations Trust Sentry with Their Application Monitoring

Code-Level Visibility

View stack traces on issues, user-agent information, and all the metadata around an issue for all the context needed to resolve the issue.

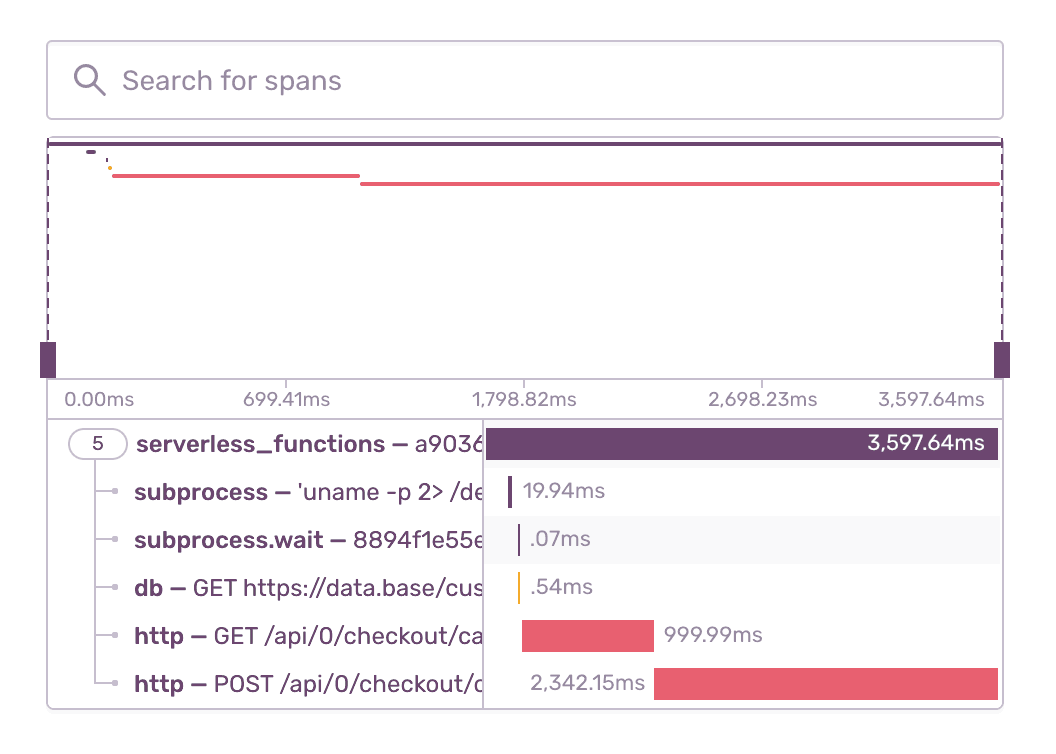
Quickly Identify Function Latencies
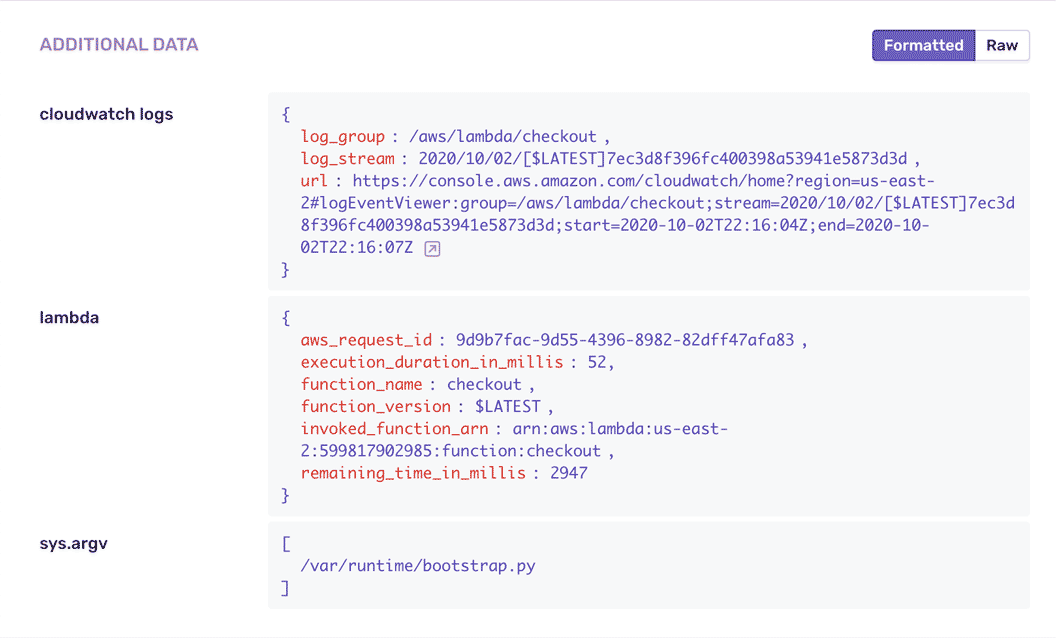
Trace those ten-second page loads to poor-performing API calls and slow database queries. The event detail waterfall visually highlights what calls are giving your customers a poor experience.

Fill in the Gaps

See what happened leading up to the issue. Get function execution details including function metadata, execution time, Amazon Resource Name, and function identity.

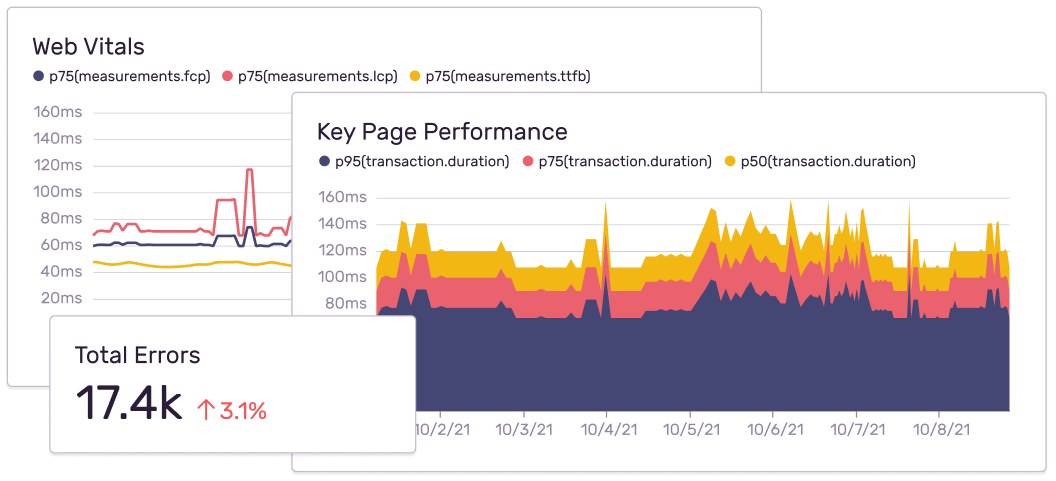
Custom Dashboards and Reporting

Learn from issues and release data to uncover trends and identify opportunities across your entire system.

FAQs

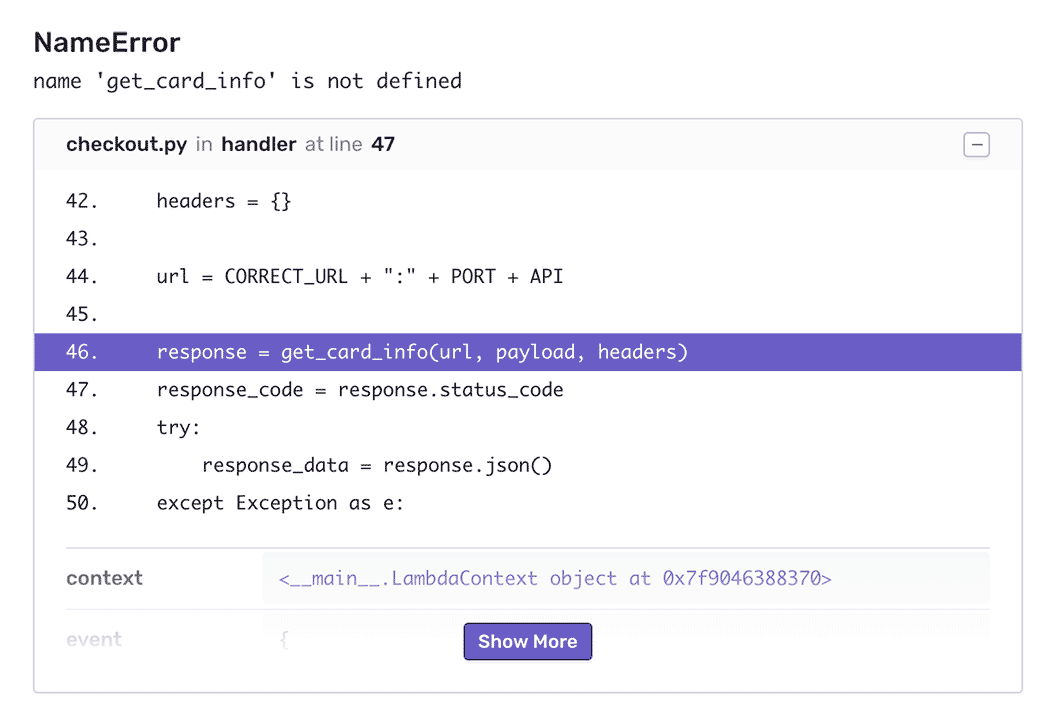
Sentry uses run-time instrumentation to capture errors. This allows users to get to the root of the problems using stack traces, breadcrumbs, function context and environment context.

CloudWatch/Stackdriver logs and metrics are hard to use to debug issues. The information is limited to some log statements and usually don't have the context needed to debug issues.

Sentry uses run-time instrumentation to get real time visibility into execution environment and report all relevant info to be able to quickly debug issues. For example source code visibility when issues occur.

CloudWatch or Stackdriver log forwarding requires parsing through logs and usually are limited to details that already exist in logs.

Sentry supports distributed tracing in addition to error monitoring for serverless functions.

You can get started for free. Pricing depends on the number of monthly events, transactions, and attachments that you send Sentry. For more details, visit our pricing page.

A better experience for your users. An easier life for your developers.