Go Error Tracking and Performance Monitoring
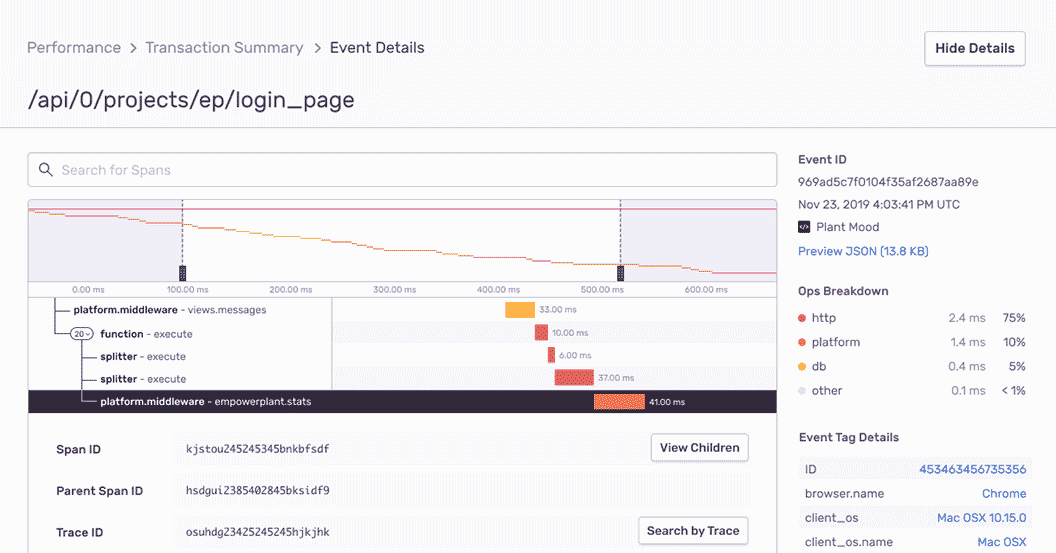
Debug Go apps and prevent crashes across your entire stack. Trace Go performance issues back to a poor performing API call and surface any related code errors. Sentry provides a single platform to optimize the performance of Go code and deliver fast customer experiences.
Getting Started is Simple
Grab the Sentry Go SDK:
go get "github.com/getsentry/sentry-go"
Configuration should happen as early as possible in your application's lifecycle:
package main

import (
	"log"
	"time"

	"github.com/getsentry/sentry-go"
)

func main() {
	err := sentry.Init(sentry.ClientOptions{
		Dsn: "https://<key>@sentry.io/<project>",
		EnableTracing: true,
		// Specify a fixed sample rate:
		// We recommend adjusting this value in production
		TracesSampleRate: 1.0,
		// Or provide a custom sample rate:
		TracesSampler: sentry.TracesSampler(func(ctx sentry.SamplingContext) float64 {
			// As an example, this does not send some
			// transactions to Sentry based on their name.
			if ctx.Span.Name == "GET /health" {
				return 0.0
			}

			return 1.0
		}),
	})
	if err != nil {
		log.Fatalf("sentry.Init: %s", err)
	}
	// Flush buffered events before the program terminates.
	// Set the timeout to the maximum duration the program can afford to wait.
	defer sentry.Flush(2 * time.Second)
}
Check our documentation for the latest instructions.
See all platforms
Go Error Monitoring With Complete Stack Traces
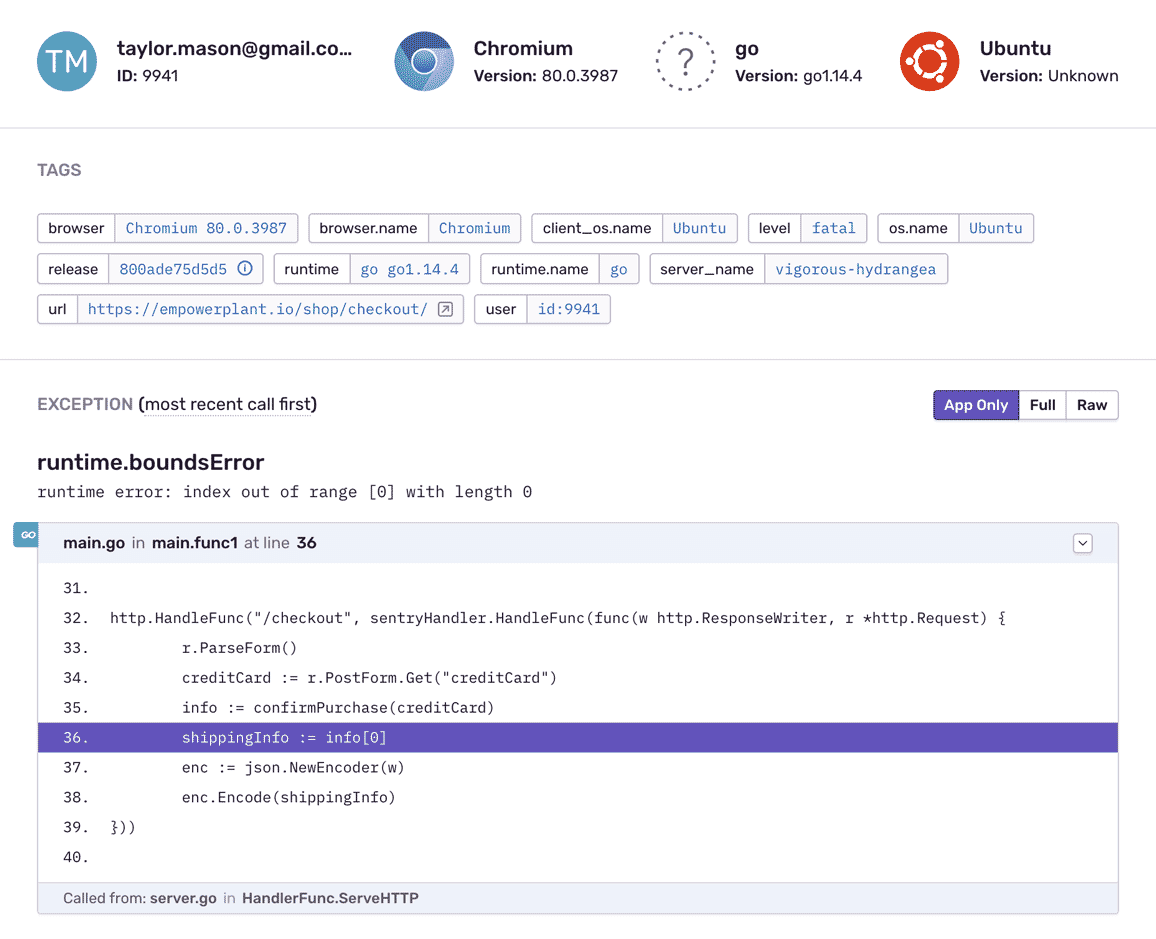
See details like filename and line number so you never have to guess with Go errors. Filter and group Go exceptions intuitively to eliminate noise. Monitor errors at scale without impacting throughput in production.

Fill In The Blanks About Go Errors
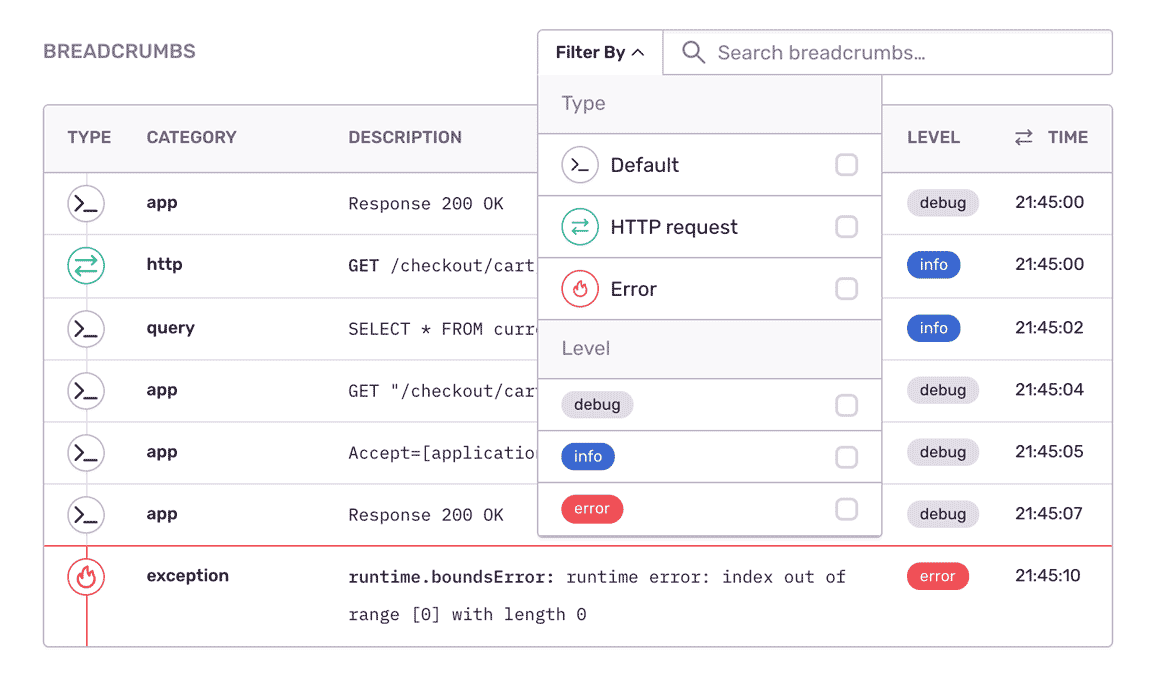
Reproduce errors without user feedback. Sentry’s Go error monitoring includes each bug’s history of events and actions.

Understand The Bigger Picture
Use issue graphs to understand frequency, scope, and impact of Goerrors and prioritize what needs to be fixed. Get alerts via email, SMS, or chat when bugs make it into production without disrupting your development workflow.
“Sentry helps our team fix the most important issues in each release.”
See The Full Picture Of Any Go Error
Understand the context that contributed to errors with tags and relevant information about your software, environment, and users.
You can also submit optional custom data to provide extra context for bug tracking that is unique to your application and business.
Find answers to key questions: Which clients’ users experienced this bug? Was their game running in 32 bit or 64 bit mode?
It’s why companies that don’t have a complete view of their infrastructure are being punished:
The average cost of network downtime is around $5,600 per minute — or $300,000 per hour.
1 out of 5 online shoppers will abandon their cart because the transaction process was too slow.
On average, a two-second slowdown in page load decreases revenues by 4.3 percent.