Full Stack Monitoring
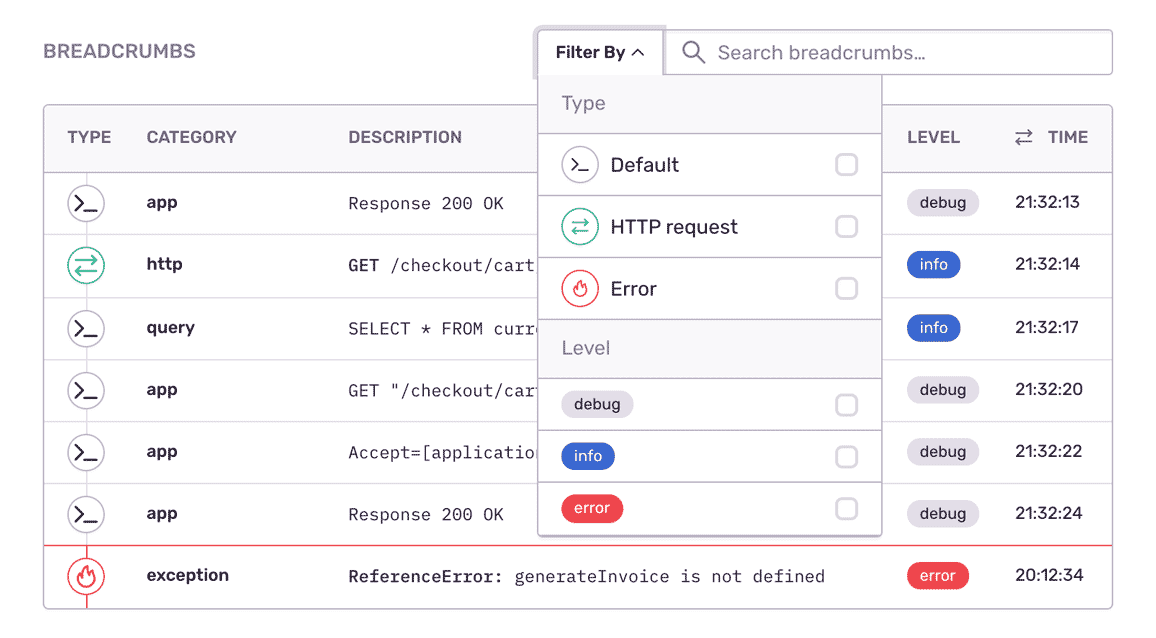
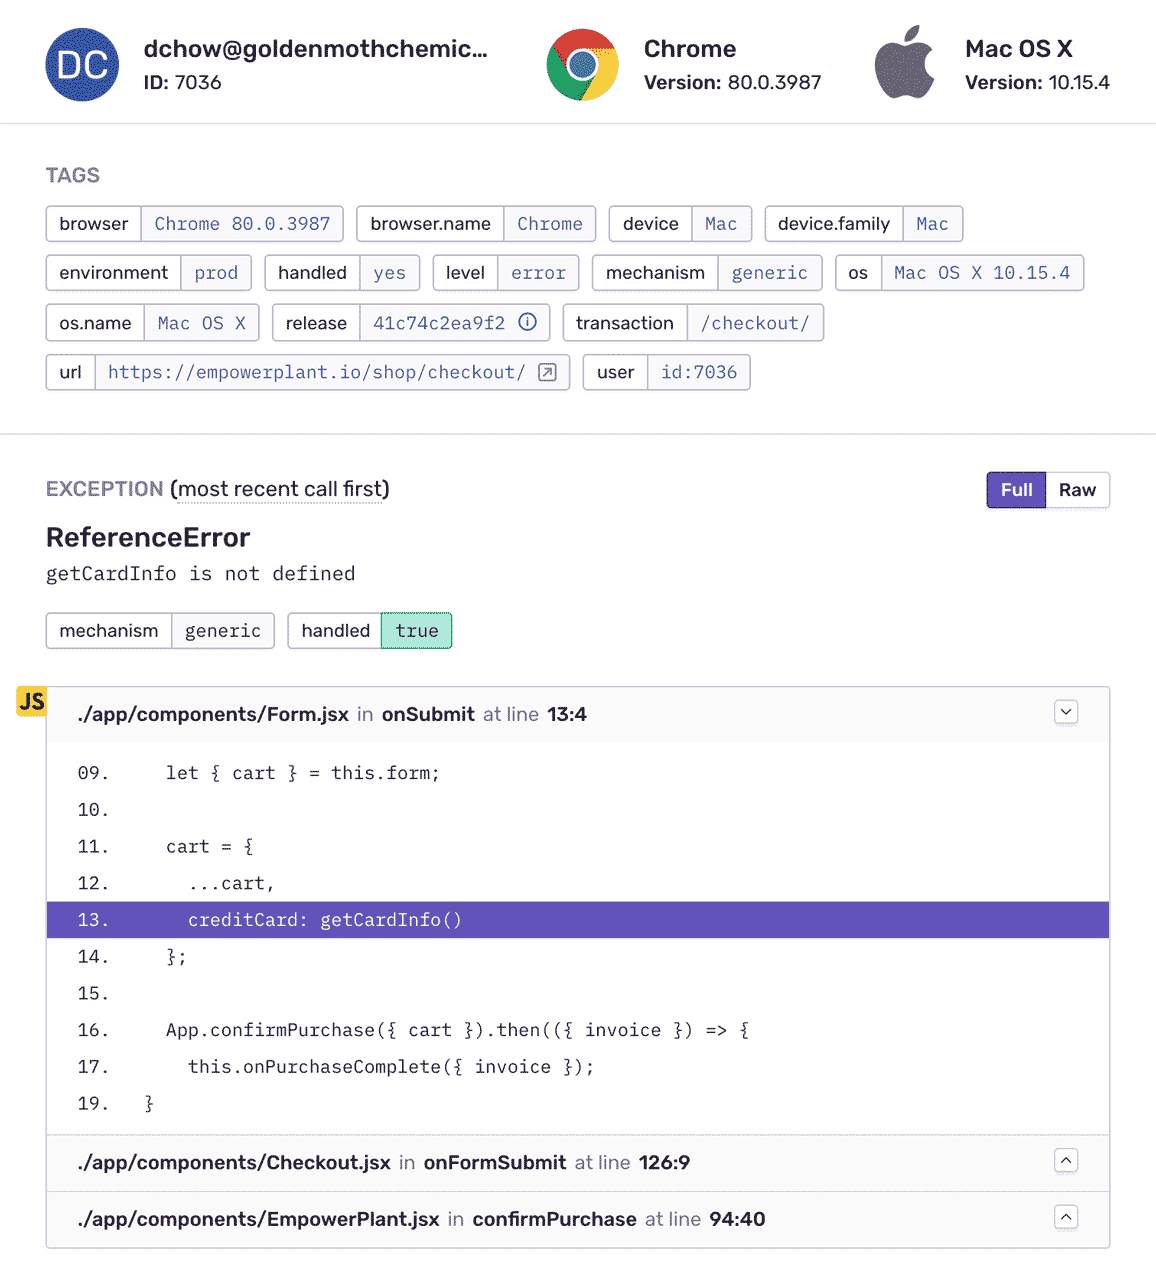
Your code is telling you more than what your logs let on. Sentry's full stack monitoring gives you full visibility into your code, so you can catch issues before they become downtime.

Learn about Tracing
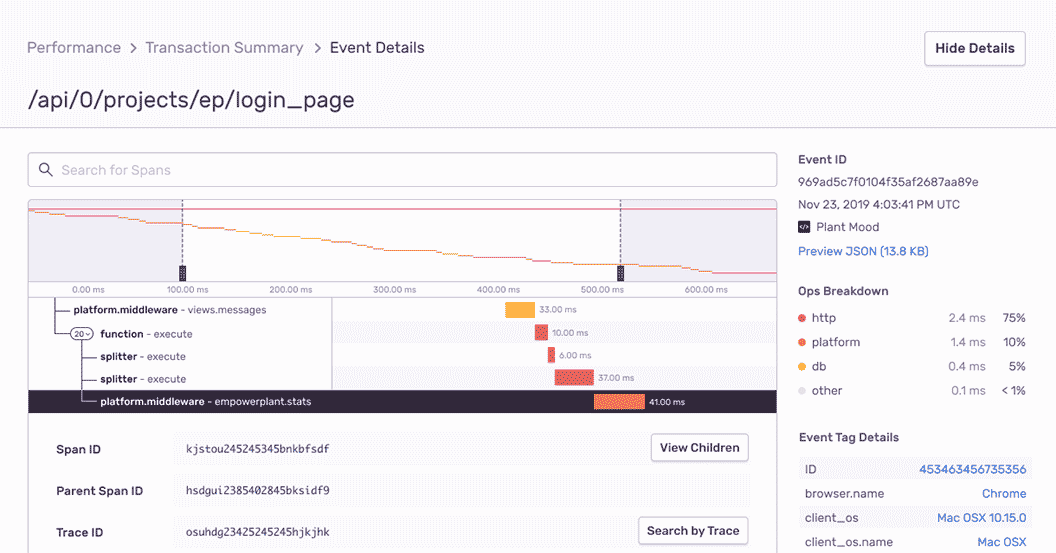
With Sentry's performance monitoring, you can trace performance issues to poor-performing api calls and slow database queries.
Distributed Tracing 101 for Full Stack Developers
Learn the ins-and-outs of distributed tracing and how it can assist you in monitoring the increasingly complex requirements of full stack applications.
Read moreTracing for the Frontend (to the Backend)
Join Dustin Bailey (Solutions Engineer) as he shows how developers can trace those pesky performance issues to poor-performing API calls & slow database queries across all your services.
Watch nowFind the Root Cause Faster with Trace View and Trace Navigator
Trace View and Trace Navigator give you a throughline between transactions across all your projects.
Read moreLearn about Suspect Spans
Find the slowest operation or "work" taking place on your service. All without having to click into each trace.
Read moreMore than 150K organizations trust Sentry with their application monitoring.

Trace. Triage. Triumph.

See the sprawl

Understand what your code is thinking. Really.
"Sometimes errors on the front-end have roots on the backend. We use Sentry's tags and metadata about a request that comes in to pass along a version of distributed tracing to link these back."
FAQs
Sentry supports every major language, framework, and library. You can browse each of them here.
You can get started for free. Pricing depends on the number of monthly events, transactions, and attachments that you send Sentry. For more details, visit our pricing page.
Sentry doesn't impact a web site's performance.
If you look at the configuration options for when you initialize Sentry in your code, you'll see there's nothing regarding minimizing its impact on your app's performance. This is because our team of SDK engineers already developed Sentry with this in mind.
Sentry is a listener/handler for errors that asynchronously sends out the error/event to Sentry.io. This is non-blocking. The error/event only goes out if this is an error.
Global handlers have almost no impact as well, as they are native APIs provided by the browsers.