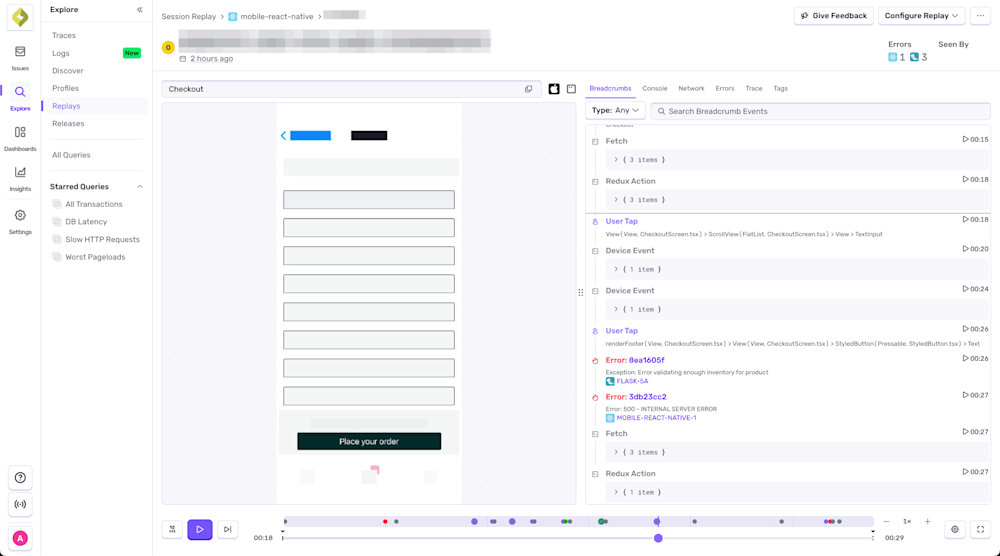
Not all bugs crash. Some just make people quit, and you’re left staring at green dashboards, wondering what went wrong. Sentry’s Real User Monitoring shows what actually happens, revealing what backend metrics miss: session-level insights, slow pages, rage clicks — all directly tied to real users and the code-level issues behind the pain.
Tolerated by 4 million developers
From rage click to root cause
Follow the trace to the point of failure
Knowing a session broke is one thing. Knowing why, and how to fix it, is another. Sentry ties frontend behavior to backend traces and context, so you’re not guessing based on vague complaints or dashboards.
With Real User Monitoring, you get:
Session Replay that captures clicks, scrolls, rage-taps, and navigation, linked to stack traces and spans
Trace-level visibility into slow scripts, failed API calls, rendering issues, and more — right from the user’s browser
Impact-first prioritization, so you can focus on the sessions affecting the most users, not just the loudest alerts
Watch what the user saw. See what broke. Fix what matters.
Monitor your Web Vitals
Measure what matters, then fix it fast
Web Vitals impact everything from SEO to user experience and revenue. But knowing a page is slow isn’t enough, you need to know why. Sentry connects frontend metrics with backend traces and code-level profiling to show exactly what’s causing the lag.
With Web Vitals Monitoring, you get:
Key metrics like LCP, INP, CLS, FCP, and TTFB, tracked in real time and rolled into a single score
Trace waterfalls and replays that reveal which calls, assets, or user actions are behind the slowdown
Code profiling that highlights the specific function or line of code causing the issue
From metric to root cause, Sentry gives you the full picture.
See what users experience

Full visibility into real user behavior
Get real-time visibility into your app’s performance, user behavior, and privacy — all in one place.
With Real User Monitoring, you’ll get:
Instant alerts for slow pages, error spikes, and downtime, with smart routing and anomaly detection to keep noise low
Full session replays that show every user click, scroll, and rage‑tap alongside stack traces and spans — no guesswork
Privacy by default, with sensitive data like passwords and credit cards stripped on the server and masking tools you can control
The result: clear context, real impact, and zero oversharing, all without switching tools.
Traditional RUM
Black‑Box Metrics: You’re staring at waterfall charts and percentile graphs that tell you something is slow, but not why‑or which user flows are paying the price. |
Context Vacuum: RUM dashboards sit in their own silo, so you’re forced to juggle separate tools for errors, traces, and logs—good luck matching a Core Web Vital spike to the deploy that caused it. |
Privacy Panic: Instrumenting the browser feels risky; masking, scrubbing, and compliance settings live in a different console (or worse, a legal doc), so teams ship half‑baked configs—or none at all. |
Single‑Page‑App Blind Spots: Traditional RUM still thinks every navigation is a full page load, so route changes, lazy‑loaded bundles, and long tasks hide in plain sight. |
Developer Disengagement: The performance team cares, the business team cares, but the people who can actually fix the code? They’re busy because the RUM tool speaks in metrics, not stack traces. |
RUM with Sentry
Full Visibility into Performance: Web Vitals, custom spans, and error events land in one place—right next to the exact release, commit, and line of code. Move directly from symptom to fix without tab‑surfing. |
Session‑Aware Debugging: Jump straight from a 400 ms INP outlier to a Session Replay of the actual click path, console logs, and network chatter that caused it. No more “can you record your screen?”. |
Privacy Built‑In: Field‑level scrubbing, domain‑level blocking, and one‑click GDPR/CCPA modes ship with the SDK, so legal sleeps well and you still get the diagnostics you need. |
Instrumentation built for SPAs: Route changes, virtual pages, and long tasks are auto‑captured, so modern frameworks (React, Vue, Next, Remix—you name it) finally get monitoring that understands them. |
Developer‑First UX: Clean UI, GitHub‑linked stack traces, and IDE‑ready deep links mean the folks writing code actually use the tool—turning “somebody should fix this” into “PR #457 closes it.” |
Getting started with Sentry is simple
We support every technology (except the ones we don't).
Get started with just a few lines of code.
Install
The Replay integration is already included in your browser or framework SDK NPM packages. If you’re using CDN bundles instead of NPM packages, you need to load the Replay integration CDN bundle in addition to your browser bundle:
npm install --save @sentry/browser
Set Up
To set up the integration, add the following to your Sentry initialization. There are several options you can pass to the integration constructor. See the configuration documentation for more details.
// import Sentry from your framework SDK (e.g. @sentry/react) instead of @sentry/browser
import * as Sentry from "@sentry/browser";

Sentry.init({
  dsn: "https://examplePublicKey@o0.ingest.sentry.io/0",

  // This sets the sample rate to be 10%. You may want this to be 100% while
  // in development and sample at a lower rate in production
  replaysSessionSampleRate: 0.1,

  // If the entire session is not sampled, use the below sample rate to sample
  // sessions when an error occurs.
  replaysOnErrorSampleRate: 1.0,

  integrations: [
    Sentry.replayIntegration({
      // Additional SDK configuration goes in here, for example:
      maskAllText: true,
      blockAllMedia: true,
    }),
  ],
});
That's it. Check out our documentation to ensure you have the latest instructions.

release pace without risking undetected issues in production
decrease in debugging time
projects migrated to Sentry in <2 months


