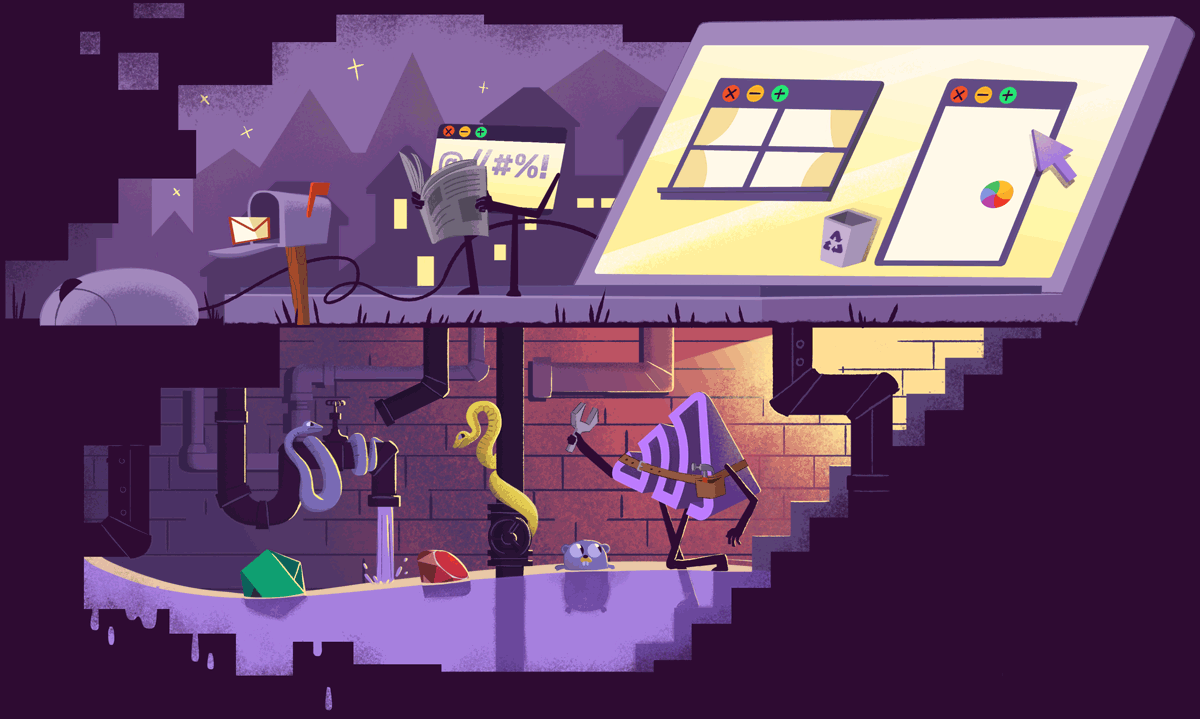
Logback Error Monitoring
Debug Logback apps and prevent crashes across your entire stack with Sentry. Improve your Logback monitoring workflow with a full view of releases so you can triage errors and prioritize live issues.
More than 150K Organizations Trust Sentry with Their Application Monitoring
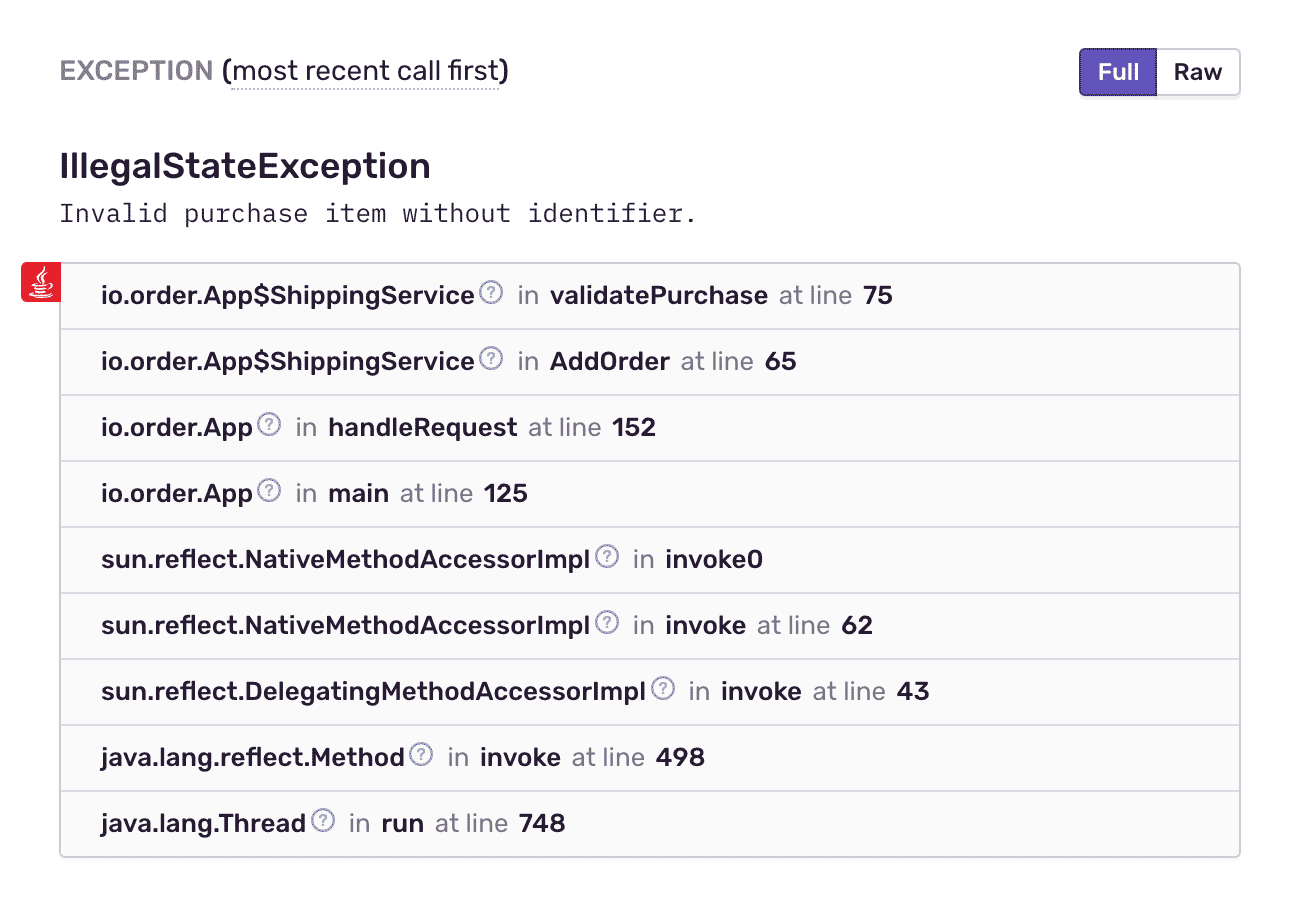
Logback Error Monitoring with Complete Stack Traces
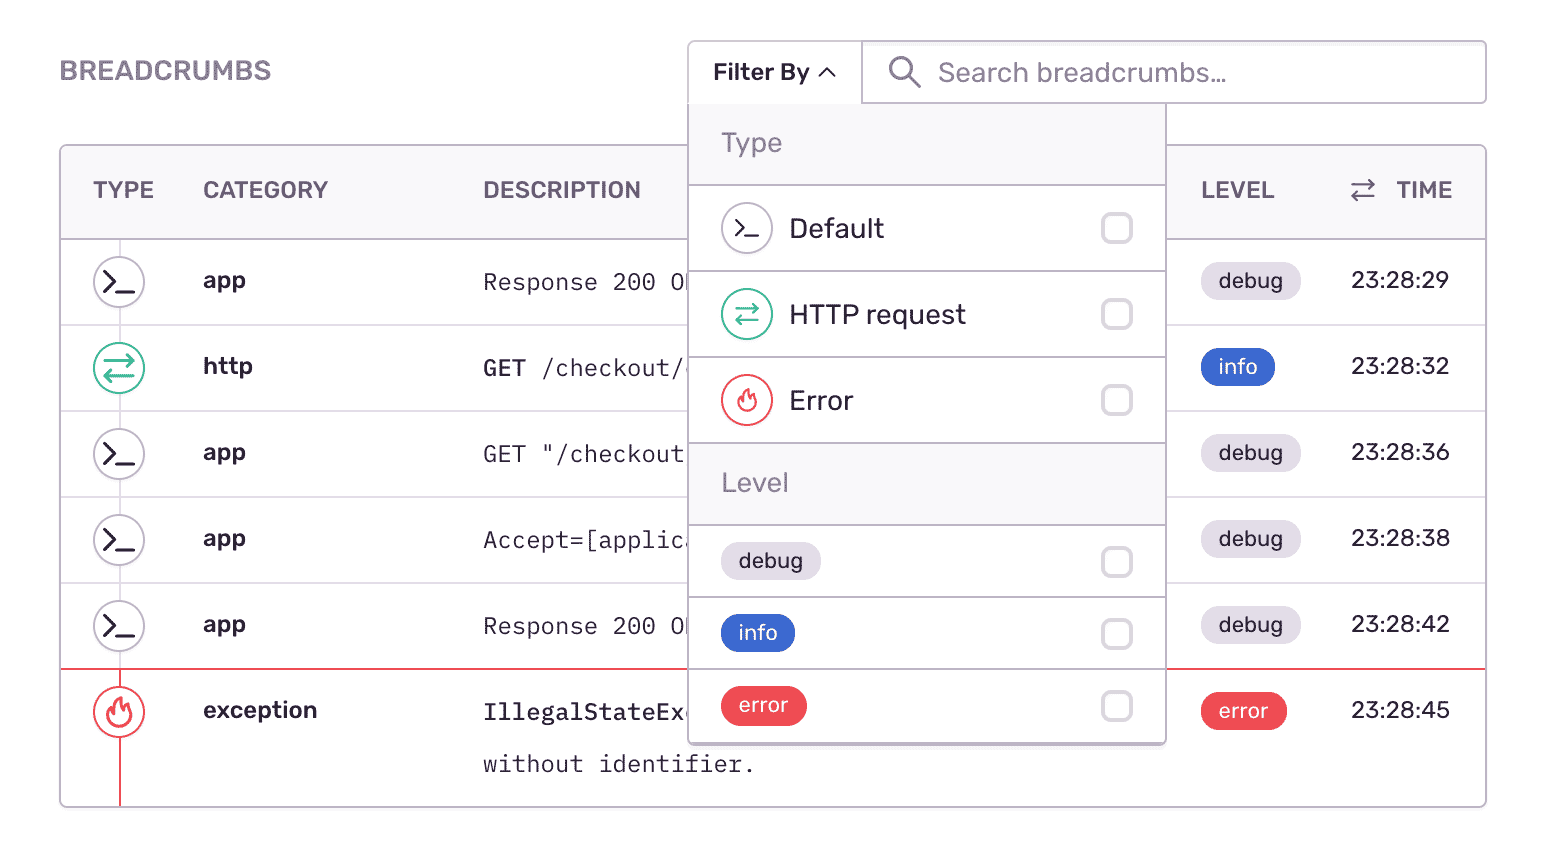
Fill In the Blanks About Logback Errors
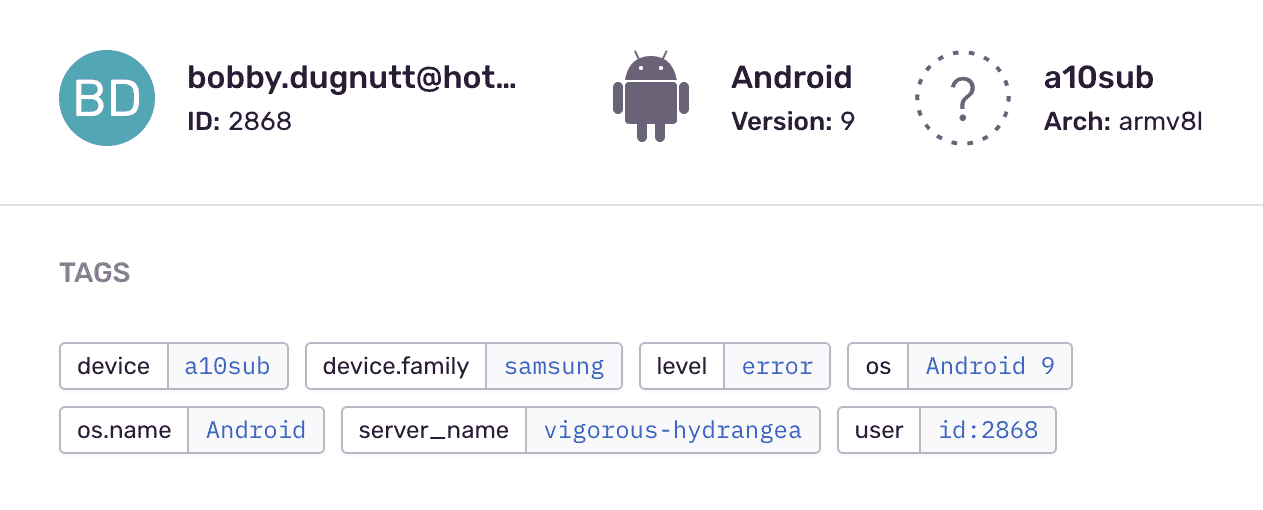
Resolve Logback Errors With Max Efficiency, Not Max Effort

Resolve Logback errors with max efficiency, not max effort
- Improve workflow with a full view of releases so you can mark errors as resolved and prioritize live issues.
- Learn in which version a bug first appeared, merge duplicates, and know if things regress in a future release.
- Add commit data to automatically suggest an owner of each Logback error and instantly send deploy emails.
"Sentry's high-quality tooling helps Disney+ maintain high-quality service to its tens of millions of global subscribers."
Is your data secure? You better believe it.
Just look at all the high-quality security features all accounts get, regardless of plan.
- Two-Factor Auth
- Single Sign-On support
- Organization audit log
- SOC 2 Type II and ISO 27001 certified
- HIPAA attestation
- PII data scrubbing
- SSL encryption
- Data Processing Addendum (includes latest EU SCCs)
- Privacy Shield certified
FAQs
When Spring Boot is configured to generate Git information every event triggered by Sentry will have a release field set to the current Git commit ID that will enable Monitor Release Health Sentry feature. More details here.
You can get started for free. Pricing depends on the number of monthly events, transactions, and attachments that you send Sentry. For more details, visit our pricing page.
The Sentry Java SDK supports Java 1.8 and above, and works with Kotlin, Scala and other JVM languages. It ships dedicated integrations for Spring Boot, Spring, Servlet, Logback, Log4j 2.x and java.util.logging, and there is a dedicated Kotlin guide.
Gradle and Maven plugins upload source context so your stack traces show the surrounding code, and there is an OpenTelemetry agent if you already run an OTel pipeline.
Yes. Sentry Logs lets you send, view, and query structured logs from your application alongside your errors and traces. Because logs sit next to the error and the trace that produced them, you get the granular context — retries, API failures, internal state — that spans and stack traces alone can miss, without switching tools.
Learn more about Logs in Sentry.
Seer is Sentry's AI debugging agent. It reads the full context Sentry already has — the error, its stack trace, the surrounding trace, logs, and profiles — to find the root cause of an issue and propose a fix. Seer can open a pull request with that fix, hand the work to an external coding agent, or review your PRs before they ship.
Supporting Resources
Improve your 99% latency with 1% effort.
Try Sentry's Logback monitoring today.