Code breaks, fix it faster
Application monitoring software considered "not bad" by 4 million developers.
Application monitoring software considered "not bad" by 4 million developers.

100,000+ Growing Teams Use Sentry to Find Problems Fast
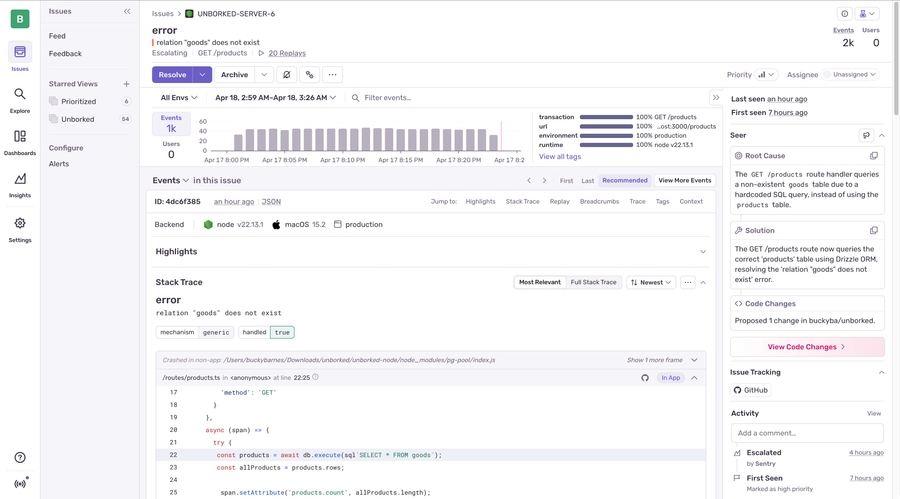
Get all the context. Sentry will tell you the environment, device, OS, even the very commit that introduced the error - down to the broken line of code.
Keep your entire team informed with custom alerts in Slack, two-way sync issues with Jira, and track releases from GitHub, Vercel, or Netlify.
With Tracing, see the complete, end-to-end path that data takes through your distributed system to pinpoint the exact origin of an issue. Navigate to a trace from a correlated metric, specific issue, or search.
Sentry automatically detects and notifies you of critical performance issues so you can trace every slow transaction to a poor-performing API call or DB query.
Pinpoint the specific operations that may be causing issues by searching for traces matching criteria like a route, API endpoint, or user ID—or get a quick overview of how your application is performing.
Navigate your application's console output, network calls, and even inspect your application's DOM tree. It's like your browser's dev tools right inside Sentry.
Lock down your debugging experience without sacrificing user privacy with a range of privacy controls to ensure no sensitive user information leaves the browser.
See dead clicks and rage clicks in the Replay view to understand where users are getting stuck.
Code coverage pull request comments allow you to quickly analyze your PR's coverage and risk without leaving your workflow.
Catch software issues early in the development process, preventing them from escalating into more complex and time-consuming problems.
Create custom statuses and group coverage in your repo without modifying your test setup using Flags and Components.
We support every technology (except the ones we don't).
Get started with just a few lines of code.
Just run this commmand to sign up for and install Sentry.
npx @sentry/wizard@latest -i nextjs
Enable Sentry Tracing by adding the below code.
import * as Sentry from '@sentry/nextjs';

Sentry.init({
  dsn: 'https://examplePublicKey@o0.ingest.sentry.io/0',

  // We recommend adjusting this value in production, or using tracesSampler
  // for finer control
  tracesSampleRate: 1.0,
});
That's it. Check out our documentation to ensure you have the latest instructions.
Security and compliance are top priorities for Sentry because they are fundamental to your experience. We use a variety of industry-standard technologies and services to secure your data from unauthorized access
Get started with the only application monitoring platform that empowers developers to fix application problems without compromising on velocity
Here’s a quick look at how Sentry handles your personal information (PII).
×We collect PII about people browsing our website, users of the Sentry service, prospective customers, and people who otherwise interact with us.
What if my PII is included in data sent to Sentry by a Sentry customer (e.g., someone using Sentry to monitor their app)? In this case you have to contact the Sentry customer (e.g., the maker of the app). We do not control the data that is sent to us through the Sentry service for the purposes of application monitoring.
Am I included?We may disclose your PII to the following type of recipients:
You may have the following rights related to your PII:
If you have any questions or concerns about your privacy at Sentry, please email us at compliance@sentry.io.
If you are a California resident, see our Supplemental notice.


