
About Yuki
Yuki, a Visma company based in the Netherlands, provides small and medium-sized businesses and accounting firms with an easy-to-use, automated accounting and tax service. Clients send financial documents to Yuki, whose software automatically processes the documents and handles financial reporting and tax preparation.
Like many tax and accounting software platforms, Yuki experiences intense usage for approximately two weeks every quarter. With features that remain inactive for extended periods during the low seasons, bugs and performance issues would go unnoticed — even with Yuki’s engineers QAing locally and monitoring in production. Slowdowns only manifested during peak usage, causing frustration for users during an already stressful time and requiring developers to treat every issue as a priority 0 (p0).
While the team was fast to resolve issues, as the company grew, their homegrown logging and monitoring solutions were no longer scaling with them. Specifically, engineers lacked visibility into performance issues, making troubleshooting difficult and reactive. If slowdowns were found, they had no way to prioritize which to fix first because they couldn’t see the number of users affected. Instead, they relied on engineers to determine if the issue was critical by looking at the code and guessing its impact based on how many components it touched.
“As our platform grew, customer complaints about slowdowns increased. But to solve these slowdowns, engineers had to go back and forth between customer tickets and emails since they couldn’t reproduce the issues locally, leading to frustration and delays in resolution,” said Arjan Peters, Technical Engineering Lead at Yuki.
The team started looking for a solution that would automatically identify, help triage, and resolve errors and performance issues before customers could write in.
Challenges
- Difficult to monitor thousands of daily errors in homegrown logging solution
- No grouping, alerting, or metrics around error impact
- Engineers lacked context and found troubleshooting difficult and time-consuming
- Performance issues show up, but the root cause is hard to determine
- No visibility into user impact
Choosing Sentry over traditional APM vendors
Yuki evaluated a few other application performance monitoring (APM) tools but ultimately chose Sentry for error tracking and performance monitoring because of the improved developer experience, deep integrations with Slack and Azure DevOps, and strong out-of-the-box support for .NET.
Unlike other solutions they evaluated, Sentry didn’t require much customization, so they could monitor errors, slowdowns, and metrics they care about out of the box.
“The other tools we evaluated were overwhelming and only showed us high-level metrics. It’s hard to take action on data alone. Not only was Sentry easier to set up, but the UX is straightforward. Sentry cuts out the noise and shows us exactly what we need to fix, like the exception or slow query,” explained Jeroen Van Haasteren, CTO at Yuki.
Plus, with access to data such as user impact and when the error first appeared, Yuki can prioritize issues based on severity and then take action on those issues - without digging around in logs or emailing back and forth with customers.
“When an issue happens, we have the exact version, release, and the complete URL. Having this information has transformed the developer experience, making it much easier to pinpoint what went wrong–and where, ” said Arjan.
Implementation requirements
- Out-of-the-box .NET SDK support
- Custom Slack alerts
- Ability to monitor the performance of database queries and external API integrations
Using Dashboards and Queries to Make Quick Improvements
Yuki is a database-centric application with plans to move toward a more distributed architecture. With this in mind, Yuki needed a solution to trace across distributed services and provide performance insights on database queries and external APIs.
“We rely on many 3rd party APIs and write complex queries. If one query is slow, it could potentially impact many different areas of our application,” explained Jeroen.
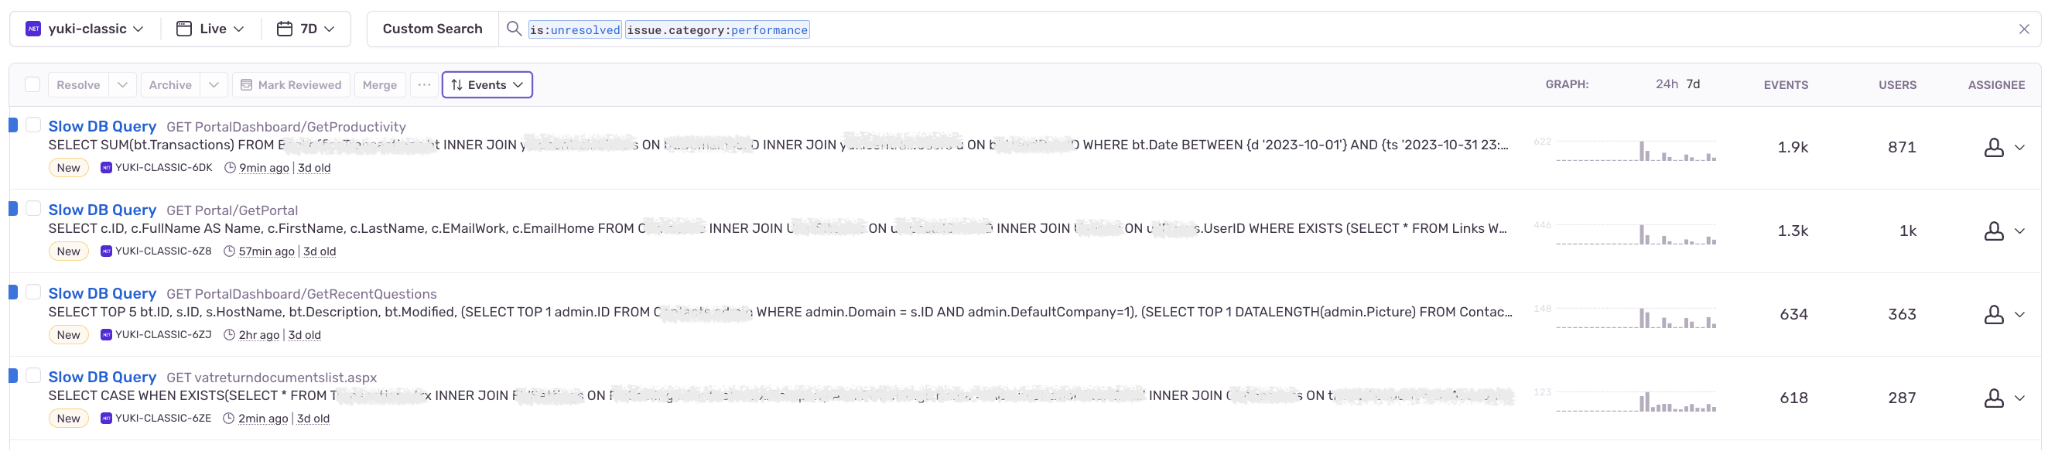
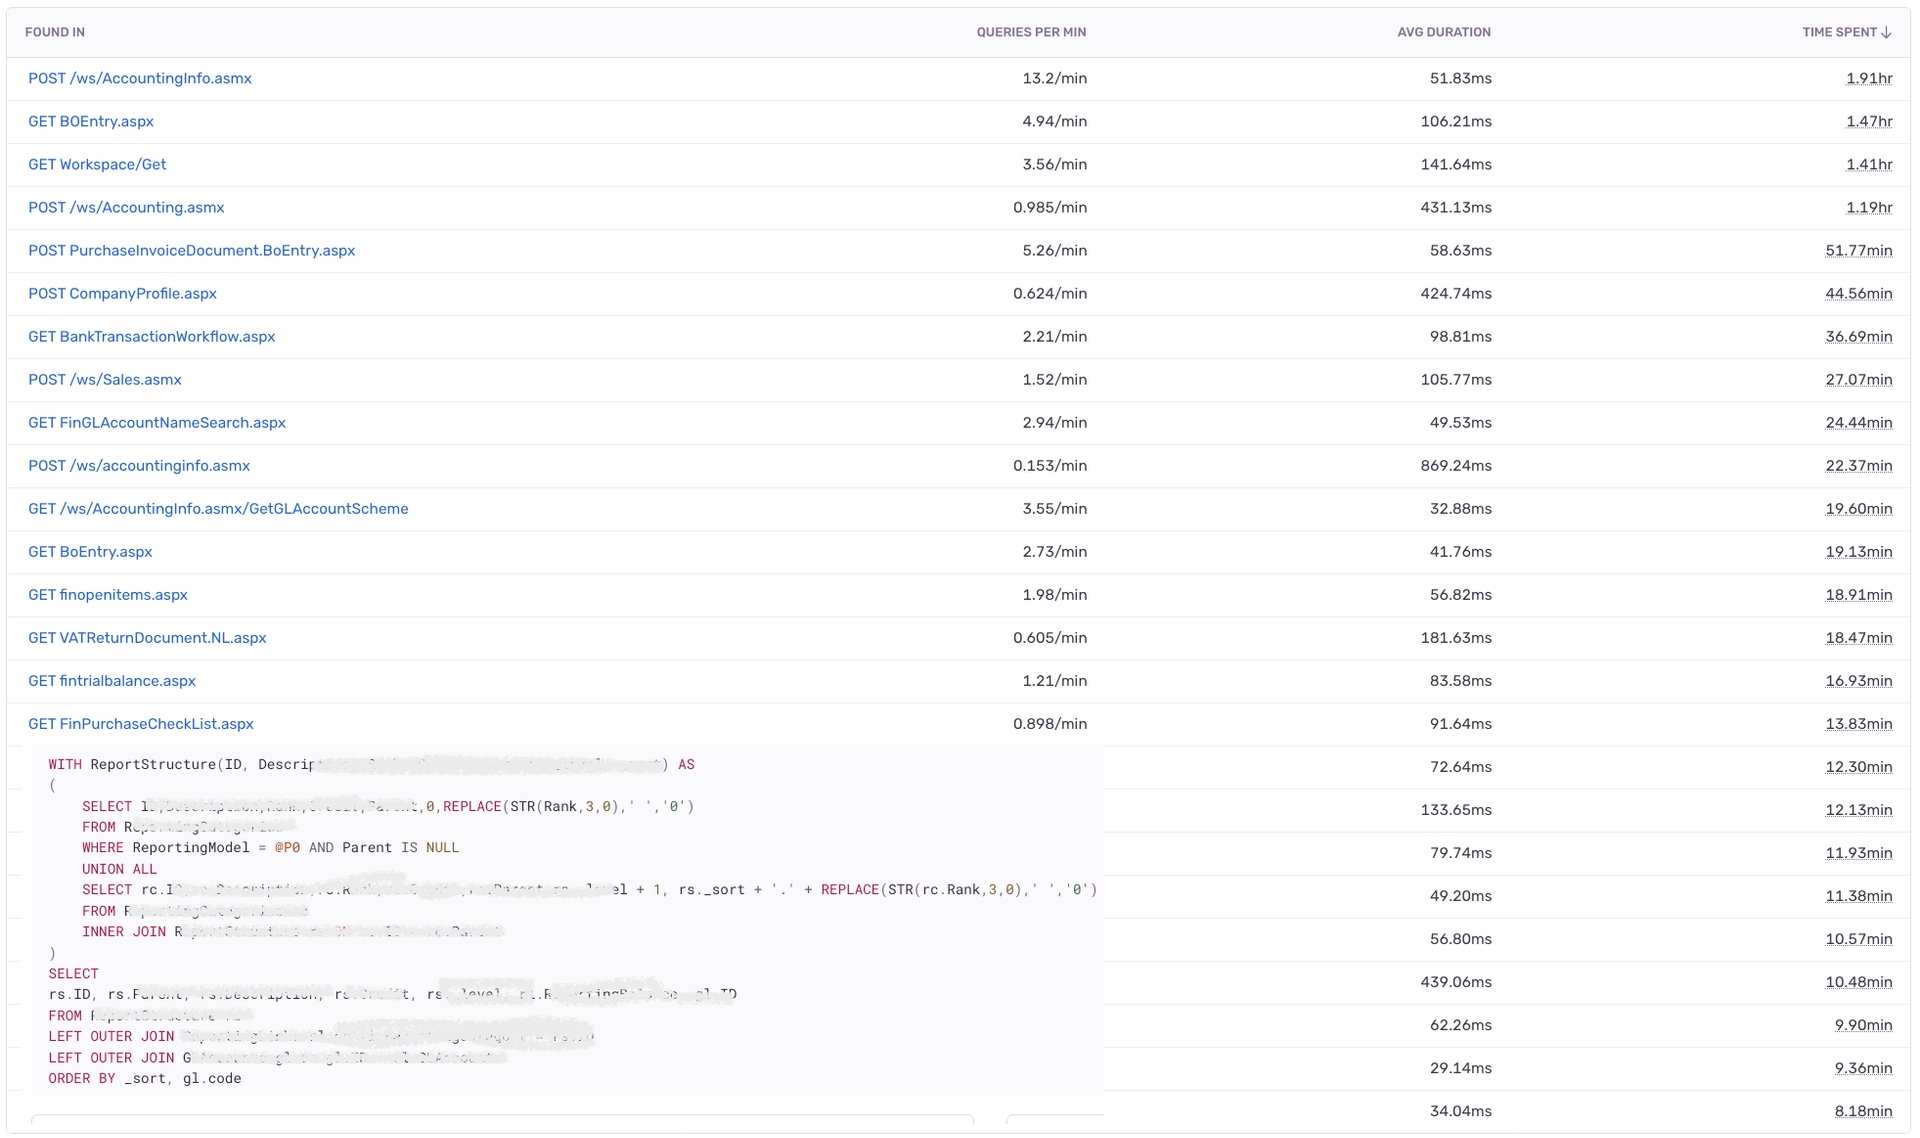
Using the Performance Queries module, Yuki can see their top regressed queries and which API endpoints they originate from. Prior, this would require someone to take time to not only identify there was a slowdown happening but then go through endpoint by endpoint to find the slow-running query.
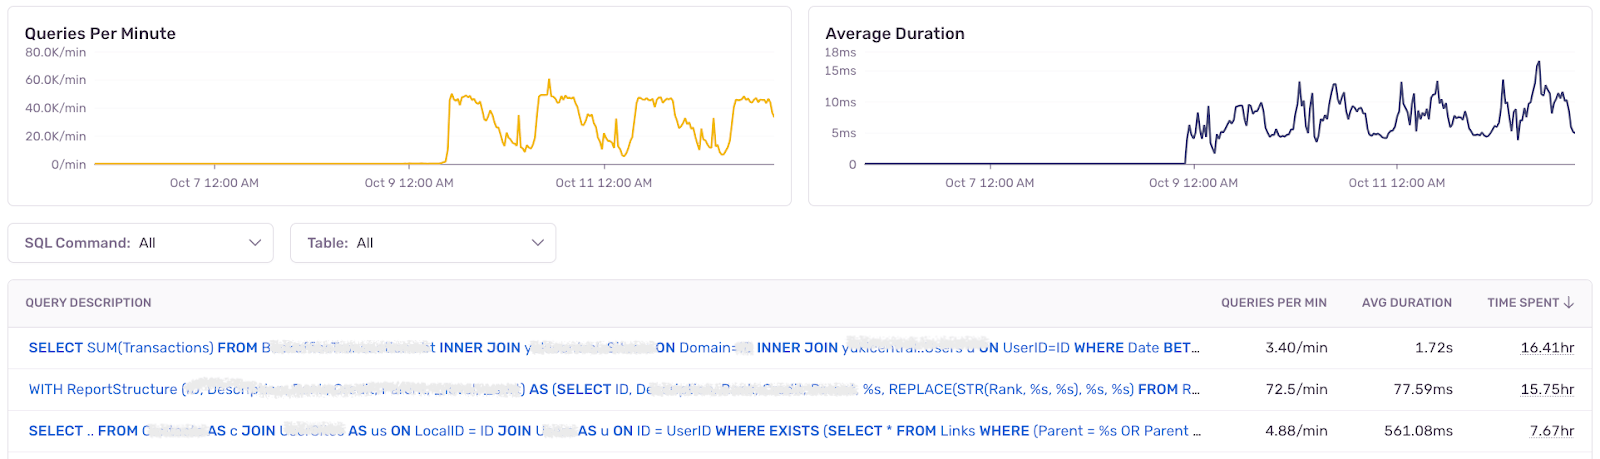
In particular, they detected one query where query load time had increased substantially.
Using Performance, Arjan traced it back to a recent change they had made within a .NET library related to image processing. Because he could see the full request URL, he could narrow down the issue and identify the image formats that were throwing the exceptions - allowing him to resolve the bug within the day.
“We knew that there were issues rendering certain image types, and because Sentry gave us the full query string with all the metadata, I could pinpoint exactly which image type was being affected,” explained Arjan.
Previously, since the query in question interacted with many different components - including the one used to load invoices– Arjan’s team would have rushed to patch a fix. However, since Arjan could see the impact with Sentry, he knew it was an isolated issue that didn’t require halting everything to push a hotfix.
“There was no need to patch between our two-week release cycles because the impact was minimal– on a menu that almost no one used. Sentry lowers our blood pressure and helps us effectively prioritize where our engineers should focus their time,” said Jeroen.
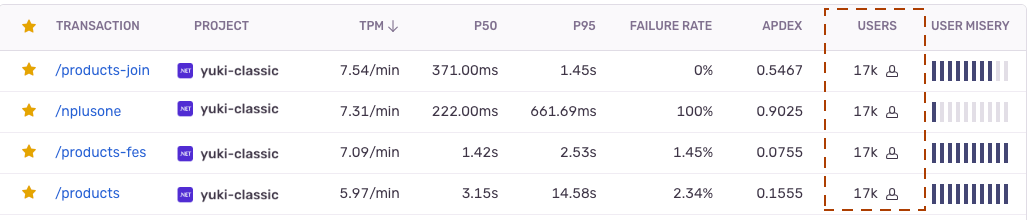
Another example is when they were creating a new version of their UI where they identified a heavily used endpoint via the TPM metric. After looking into it, they realized the endpoint was fetching a status from a database via a timer every 10 seconds - a frequency that didn’t make sense. They were able to optimize and rewrite the queries for less round-trips and apply caching for stale data. Significantly improving speed.
Catching critical connection issues with Slack
Since Yuki automates accounting, one measure of success is time spent in their app. Because of this, the engineering team tries to remove all user-impacting issues and optimize site performance to ensure their users can get in and out as fast as possible.
To help catch some of their hardest-to-detect issues quickly, Yuki has set up alerts in Slack to let them know when a SQL server database connection has failed.
Previously, Yuki would only hear about these issues from their Support team and customer calls. If there was a performance issue, their only recourse was to inspect their infrastructure for potential problems.
“Our system is too big to know where it’s slow or when the server has too many connections to accept new ones. Our infrastructure tooling points us to an API endpoint, but that’s not enough to figure out where the issue is,” shared Arjan.
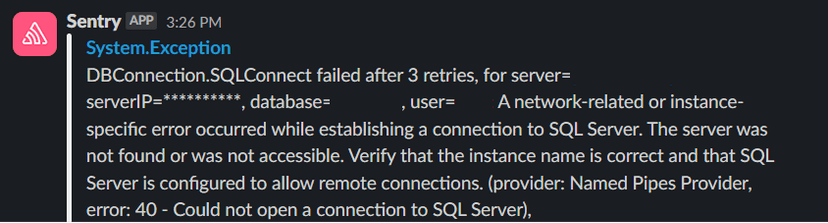
Without proper logging, it is hard to have an idea about the load and usage of their system. Since instrumenting Sentry, Yuki has detected and fixed two database connection issues where more than 5% of their customer base couldn’t access Yuki.
Once alerted, they followed the response times - looking at transaction per minute (TPM) metric - in Sentry and fixed the issues before their customers started writing in– ensuring everyone could access their invoices and tax information.
“We were faster than support and quickly rebooted the system because we got the alerts and context to resolve them.”
From 2 days to 2 hours: Regaining control, resolving issues, and reducing anxiety
Since implementing Sentry, Yuki’s engineering team has had more transparent workflows where developers own the performance of their code, improving velocity and overall developer happiness.
“Sentry removes anxiety every time we push a release. Before, we weren’t in control. With Sentry, we know we have the tools to not only find an issue, but have the data to dive deeper and resolve it. ”
With Sentry, Yuki can now see exactly where the slowdown is occurring - whether it’s an API call, function, or query– and how slow it actually is. Because of this deep context, Yuki went from resolving issues in 2 days to 2 hours.
“We know why and where something went wrong with anonymized data. We can reproduce all steps and can see the error. Sentry helps us maintain healthy code and a stable app.”
The improved engineering experience and productivity ultimately pay dividends in faster feature development and new innovations on their core accounting application.
There are more efficiency gains and proactive monitoring capabilities to unlock as Sentry rolls out company-wide. The team looks forward to adopting new capabilities such as Profiling to get to the exact line of code where the slowdown is happening and Crons to ensure their cron jobs are still running.