Custom Queries
Finding the right answer to your errors starts with asking the right query.
With Custom Queries in Discover, you're able to get to the root cause of an error
in ways that pre-built queries can't.
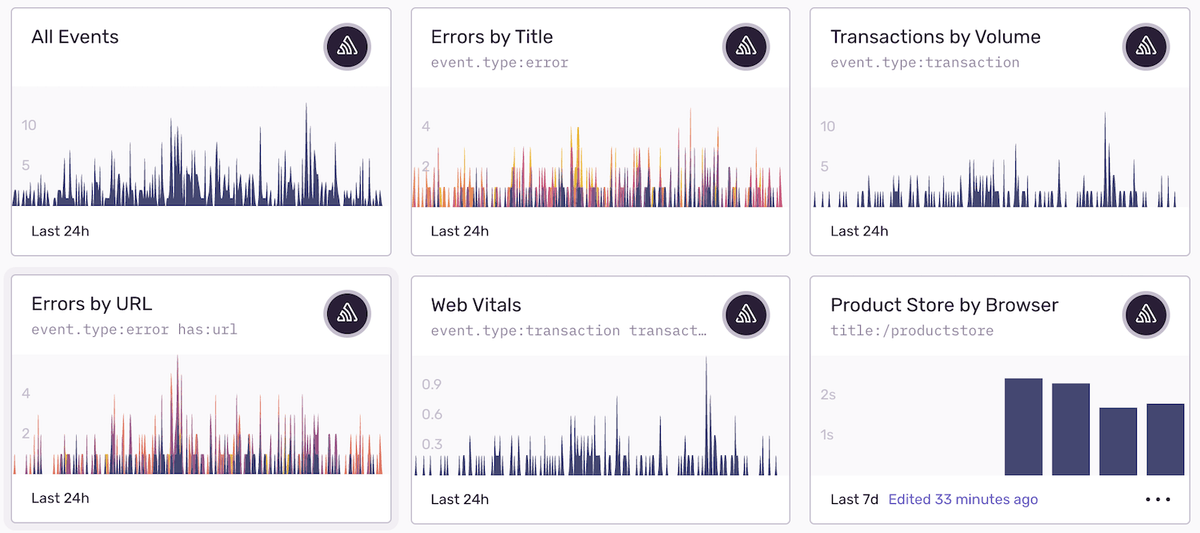
Don't just sort your data, shape it
Build and share custom views to keep a pulse on the most critical parts of your business. Correlate release health with latency and alert spike to learn where to focus engineering effort. Track release frequency, version quality over time, issues by customer or region, or literally anything you can query.
Triage. Resolve. Relax.
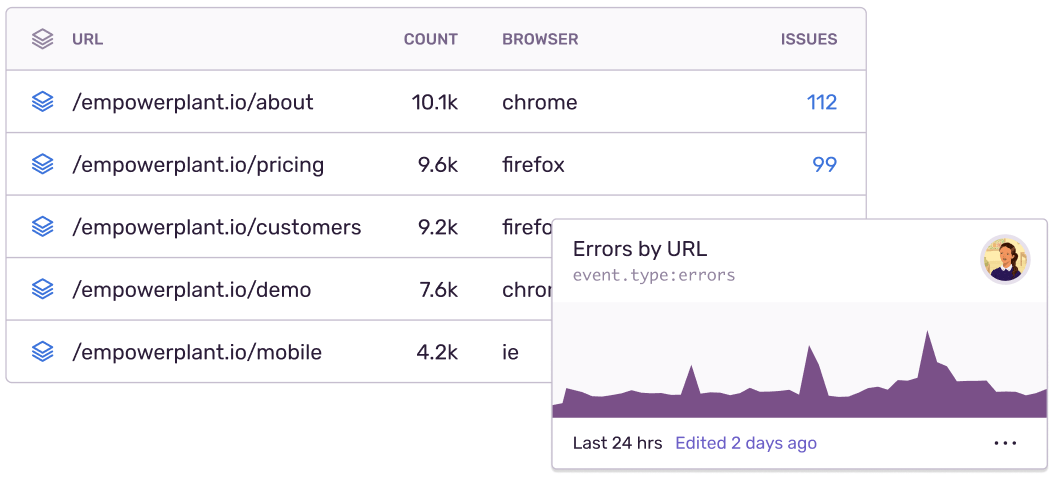
Custom Queries help you determine which parts of your code are directly responsible for the most errors or which locations are encountering the most problems. For example, Custom Query histograms can segment errors on certain users, so you can see whether multiple conditions contribute to an issue. And you can receive real-time alerts based on any custom query you construct.
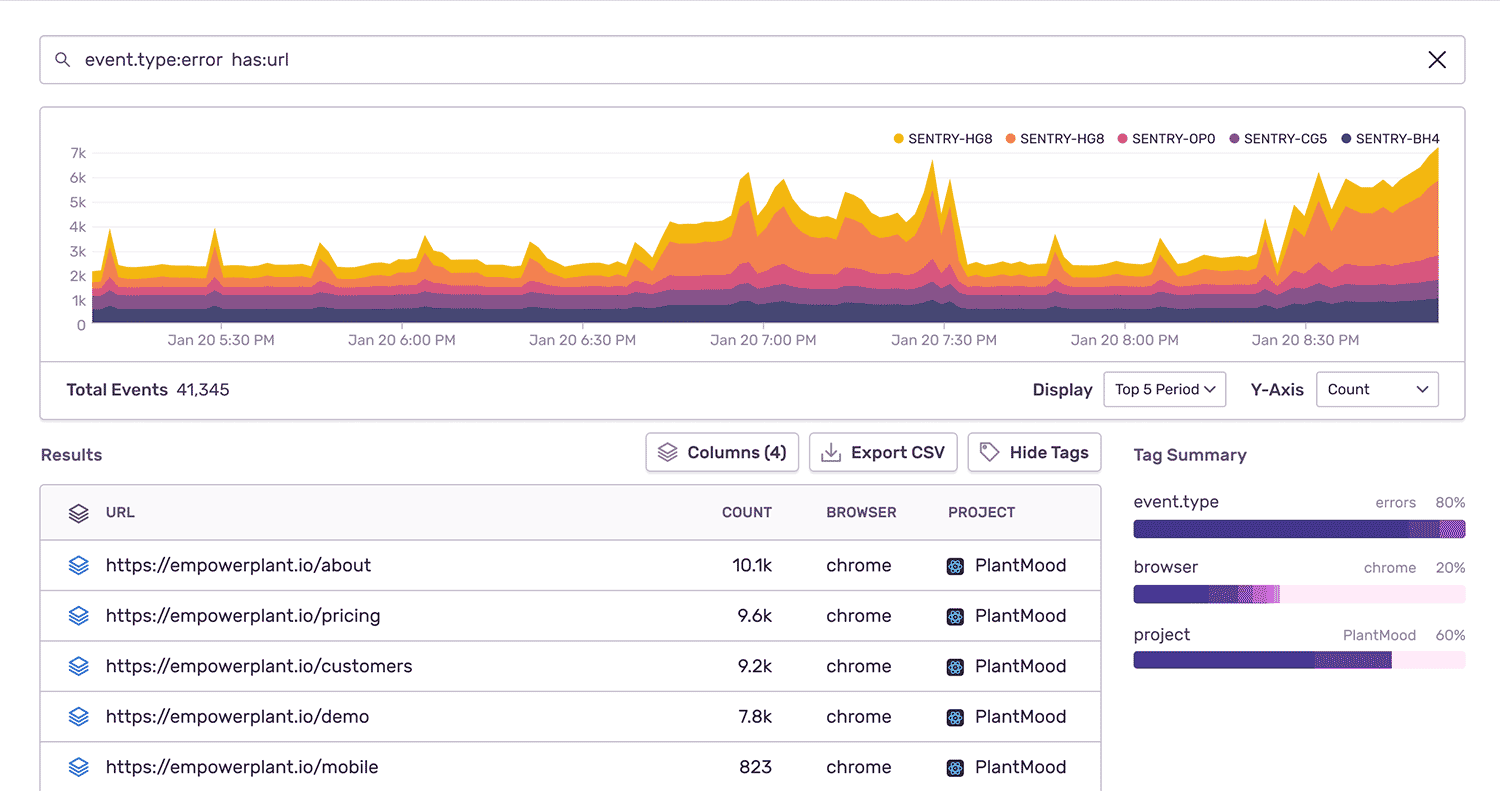
An extra dimension of visibility
With Discover, you can navigate through the results of your error or performance queries across multiple projects. And with our interactive query map, you can distribute your custom data across a variety of Y-Axis filters: Count, Average Transaction Duration, Unique User Count and much more.