Like stack traces,
but more and better
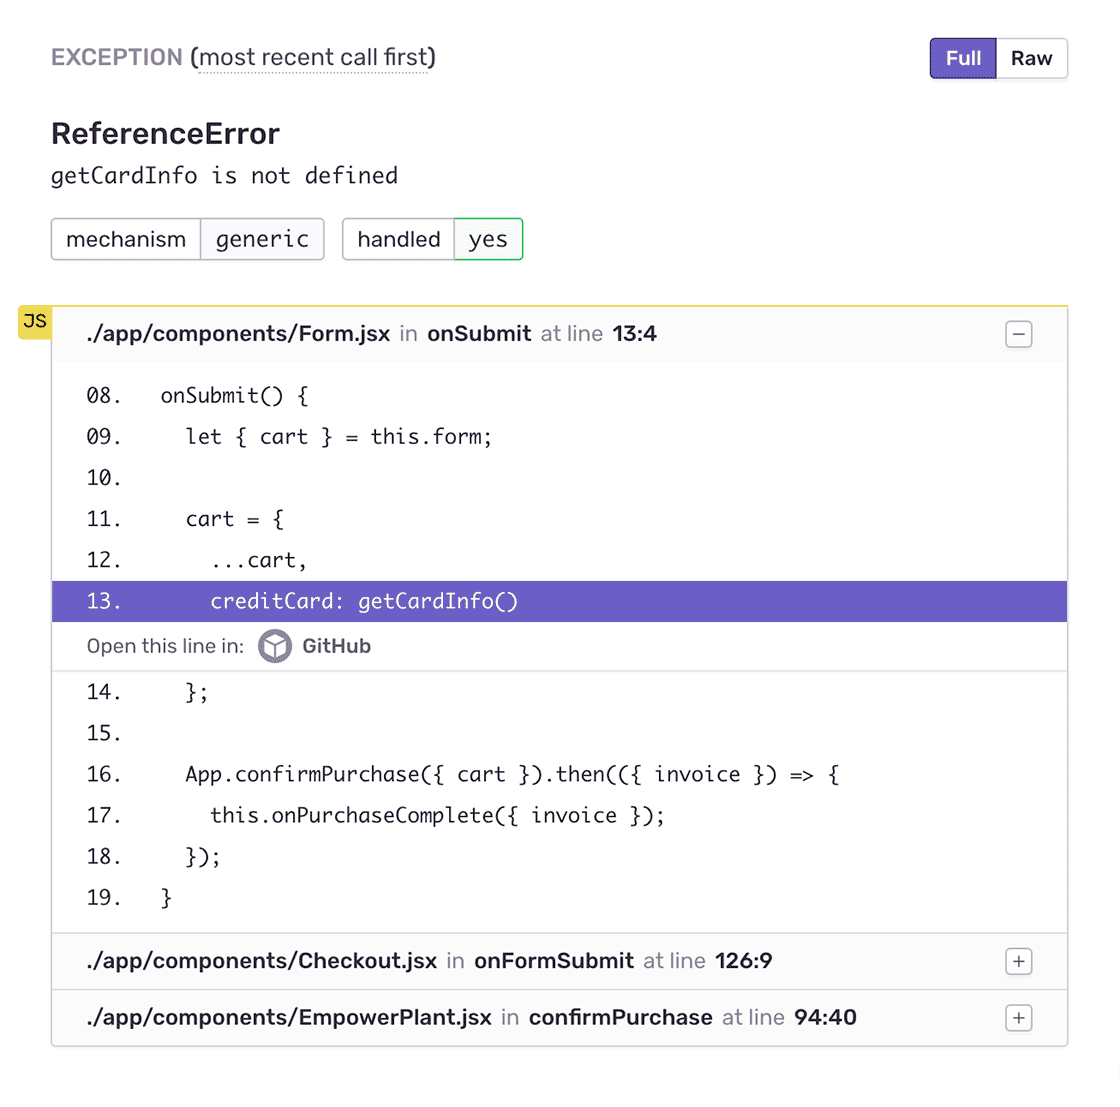
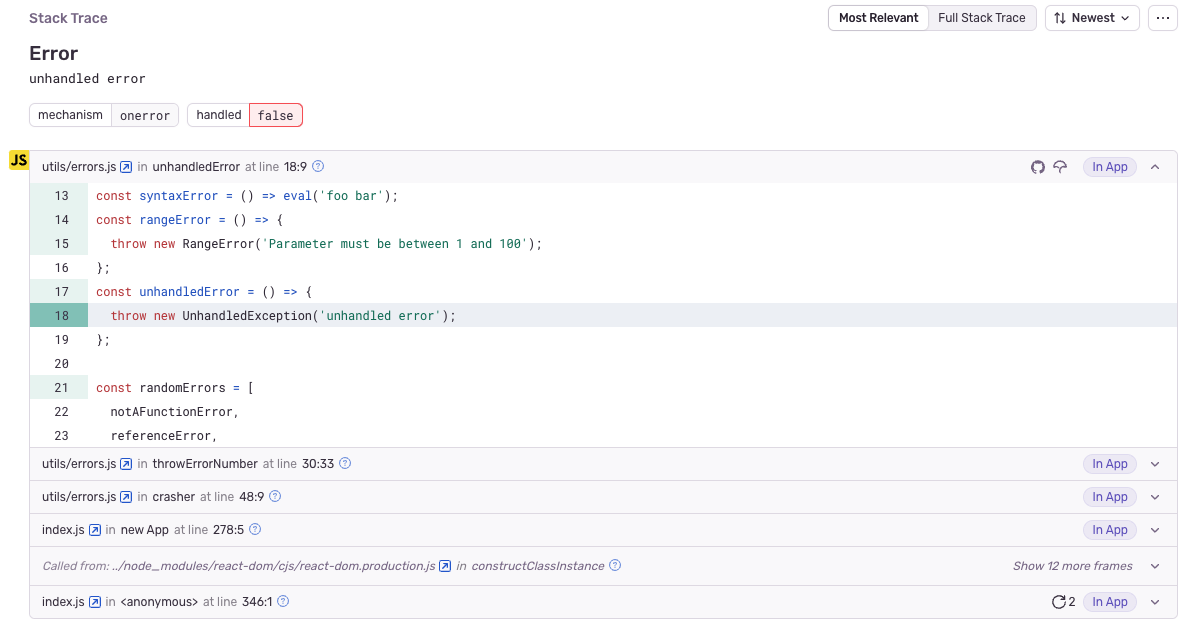
Stack traces, also referred to as a backtrace, are often used to debug or troubleshoot. Sentry enhances stack traces with all the information you wish they had to enhance debuggability.
Issue filters
To reduce noise, Sentry groups related issues by analyzing stack traces, exceptions, and messages, surfacing the most critical issues. Plus, you can update filters to focus on application-specific errors, include framework errors, or show the raw trace for deeper debugging.
Stack locals
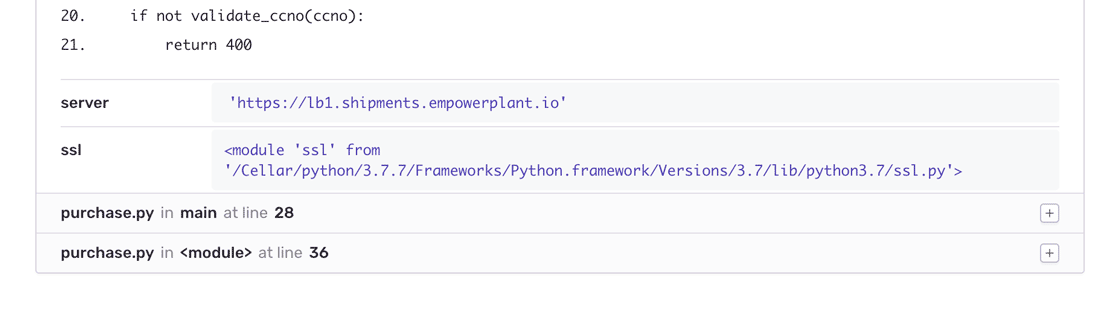
For Node, Python, PHP, and Ruby you can see the exact value of each variable at the time of the crash or error.
Compression got you down?
Sentry can show your source code even if it has been minified, compiled, transpiled, or beguiled.Sensitive data scrubbing
We automatically scrub things that include personal information, such as credit cards, passwords, or api_keys.
You can also specify custom values to scrub and filter data on the client side before it gets sent to us.
FAQs
A stack trace is the sequence of function calls that led to an error in your code. When an exception occurs, the stack trace allows you to see exactly where the error was thrown and the path the code took to get there. Stack traces are essential for debugging because they provide detailed insight into which part of the application failed, especially in complex, layered systems.
In tools like Sentry, stack traces are enhanced with features like source code visibility, so you can see the actual lines of code that triggered the error without hunting down files manually. Sentry also supports sourcemaps for JavaScript, allowing you to debug minified or transpiled code easily.
Yes, stack traces should absolutely be logged, but they should not be the only thing logged. Stack traces give you immediate feedback on where your application crashed, often giving you insight into why your application crashed. Traditional logs are useful for understanding the broader context around the event, such as user actions or system state leading up to the error.
Sentry leverages stack traces as part of issue details and offers more context by attaching error data, such as breadcrumbs (user behavior leading up to the crash) and traces (interactions among your software systems).
Yes, stack traces can expose sensitive details, especially in production environments, if not handled properly. Stack traces may reveal file paths, function names, or even sensitive data if the application doesn't sanitize them. To mitigate these risks, you should avoid exposing stack traces to end users and instead log them securely.
Sentry includes security features like automatic scrubbing of sensitive data (e.g., passwords, API keys), and allows developers to customize what information gets logged. This ensures that stack traces are useful for debugging but do not inadvertently expose sensitive information.