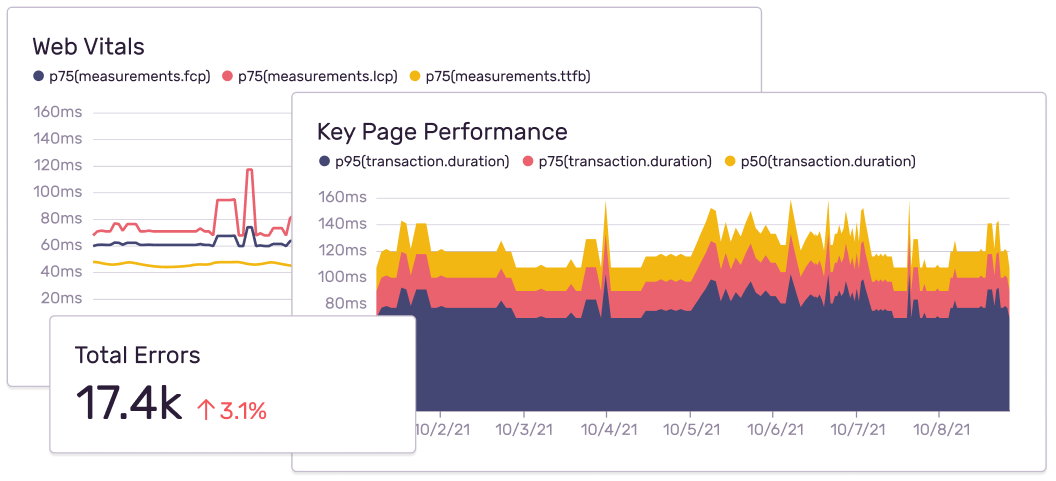
Application Dashboards
Dashboards provide data visualization of errors and transactions throughout your organization.
Graphs aren't just for Ops
Custom Views for Custom Needs
Build and share custom views to keep a pulse on the most critical parts of your business. Correlate release health with latency and alert spike to learn where to focus engineering effort. Track release frequency, version quality over time, issues by customer or region, or literally anything you can query.
See the query
behind the graph
Dig into any specific visualization with Discover via links to the auto-populated queries that power Dashboards. Edit and build your own.