
Sentry on AWS
Sentry makes monitoring your application health on AWS easier. With support for serverless, microservices, and monolith architectures, Sentry helps you connect the dots from the frontend to the backend so you can identify and solve issues holistically--without the back-and-forth.
More than 150K Organizations Trust Sentry with Their Application Monitoring
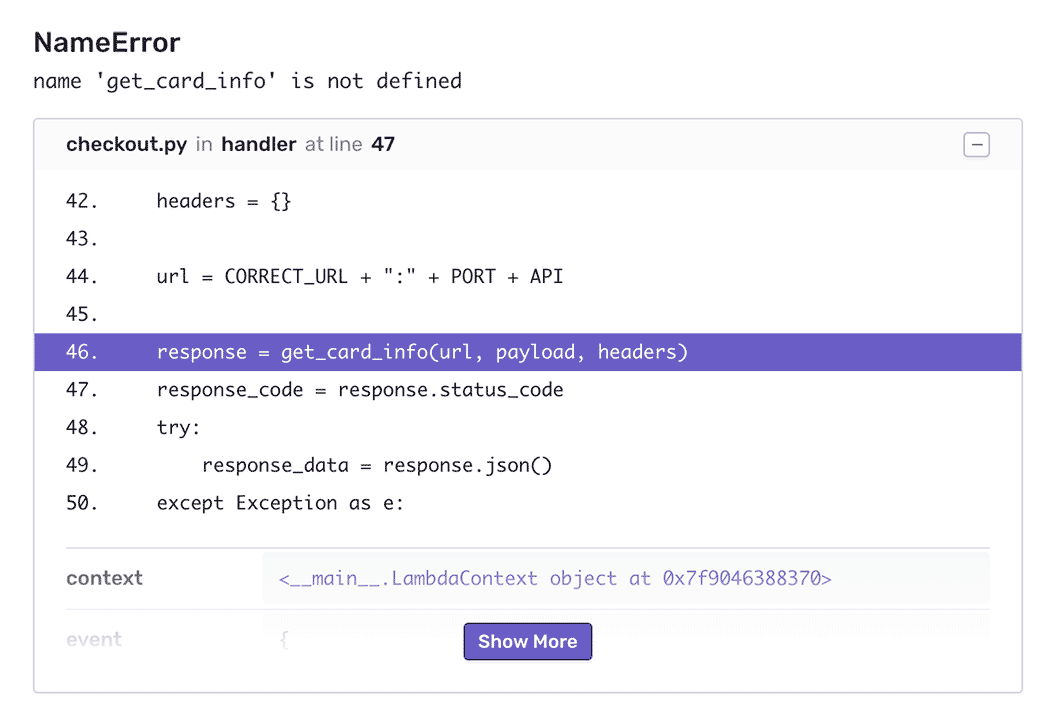
Code-Level Visibility
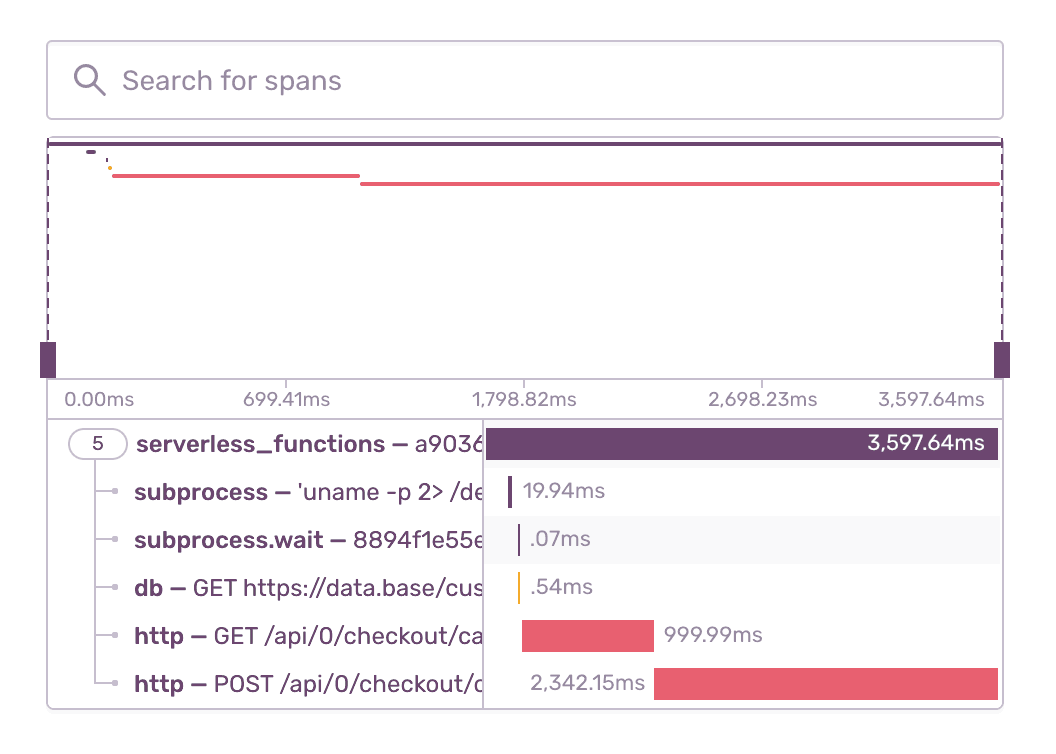
Quickly Identify Function Latencies
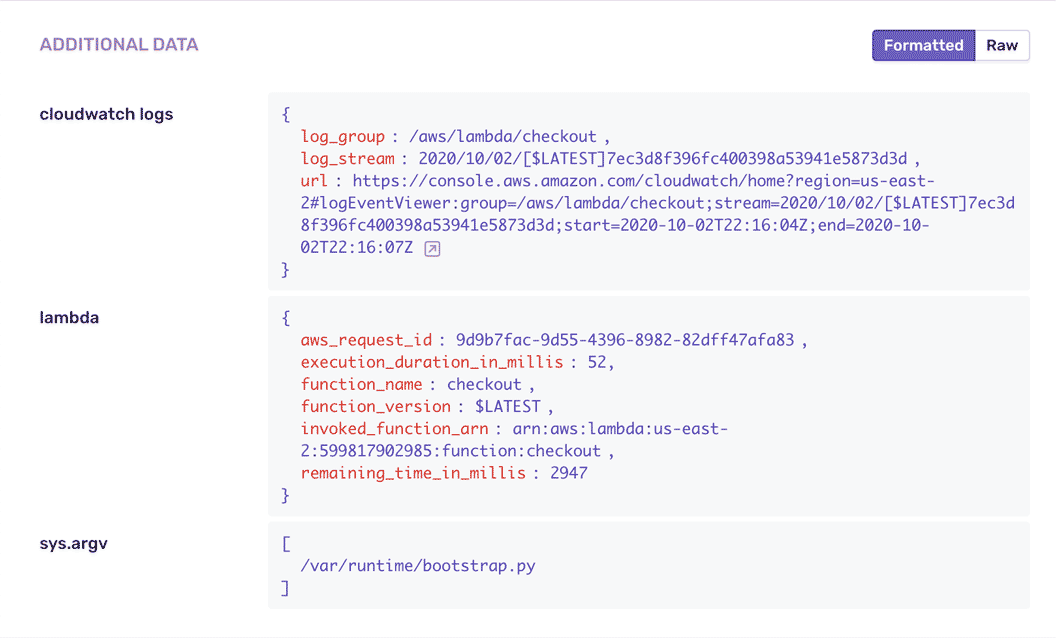
Fill in the Gaps
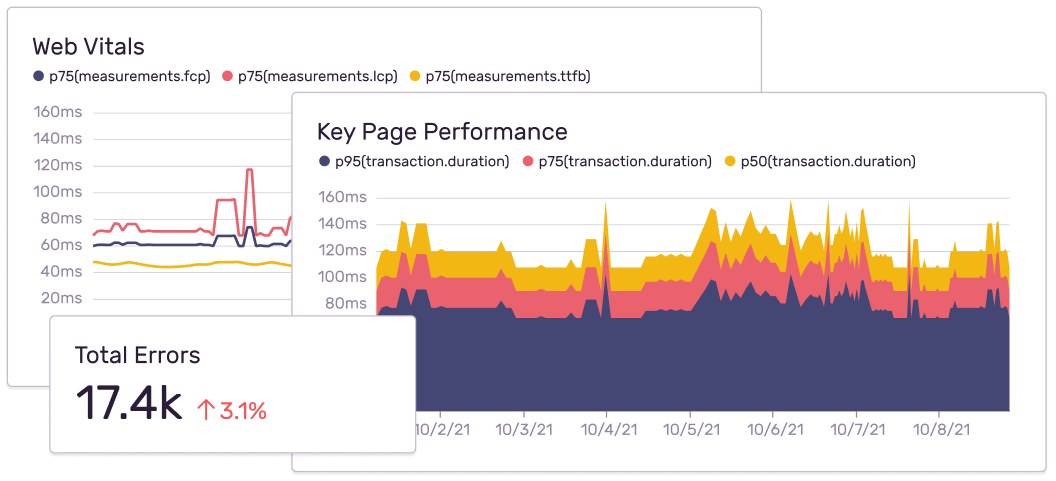
Custom Dashboards and Reporting
"We reduced false alerts by more than 50% by fine tuning the thresholds and defining the criteria that works best for us with Sentry alerts-it's a completely new world for monday.com."
FAQs
Sentry uses run-time instrumentation to capture errors. This allows users to get to the root of the problems using stack traces, breadcrumbs, function context and environment context.
CloudWatch/Stackdriver logs and metrics are hard to use to debug issues. The information is limited to some log statements and usually don't have the context needed to debug issues.
Sentry uses run-time instrumentation to get real time visibility into execution environment and report all relevant info to be able to quickly debug issues. For example source code visibility when issues occur.
CloudWatch or Stackdriver log forwarding requires parsing through logs and usually are limited to details that already exist in logs.
Sentry supports distributed tracing in addition to error monitoring for serverless functions.
You can get started for free. Pricing depends on the number of monthly events, transactions, and attachments that you send Sentry. For more details, visit our pricing page.