SvelteKit Error and Performance Monitoring

Actionable insights to resolve SvelteKit performance bottlenecks and errors. Improve your monitoring workflow with a full view of releases so you can mark SvelteKit errors as resolved and prioritize live issues.
Try Sentry For FreeRequest a Demo

Getting Started is Simple

Dedicated SvelteKit support is coming soon, check out our SvelteKit GitHub Discussion and help us inspire our SDK team to build faster. Until then, here is how you can use Sentry with SvelteKit. But it is a lot of code, and we don't like that. Coming soon: Sentry + SvelteKit with less code.

Grab the existing Sentry Svelte and Node SDKs:

npm install --save @sentry/svelte @sentry/node @sentry/tracing 

Server-side: configure the Node SDK in src/hooks.server.ts

import * as SentryNode from '@sentry/node';
import '@sentry/tracing';

SentryNode.init({
  dsn: '__DSN__',
  tracesSampleRate: 1.0,
  // Add the Http integration for tracing
  integrations: [new SentryNode.Integrations.Http()]
});

SentryNode.setTag('svelteKit', 'server');

// use handleError to report errors during server-side data loading
export const handleError = (({ error, event }) => {
  SentryNode.captureException(error, { contexts: { sveltekit: { event } } });

  return {
    message: error.message,
  };
}) satisfies HandleServerError;

Client-side: intialize the Svelte SDK in src/hooks.client.ts:

import * as SentrySvelte from '@sentry/svelte';
import { BrowserTracing } from '@sentry/tracing';

SentrySvelte.init({
  dsn: '__DSN__',
  integrations: [new BrowserTracing()],
  tracesSampleRate: 1.0,
});

SentrySvelte.setTag('svelteKit', 'browser');

// This will catch errors in load functions from +page.ts files
export const handleError = (({ error, event }) => {
  SentrySvelte.captureException(error, { contexts: { sveltekit: { event } } });

  return {
    message: error.message
  };
}) satisfies HandleClientError;

Limitations

This should provide error monitoring in most situations. Source maps are currently not yet working correctly. However, it should work for many to configure the Vite Plugin.

That’s it. Be sure to check out our documentation to ensure you have the latest instructions.

See all platforms

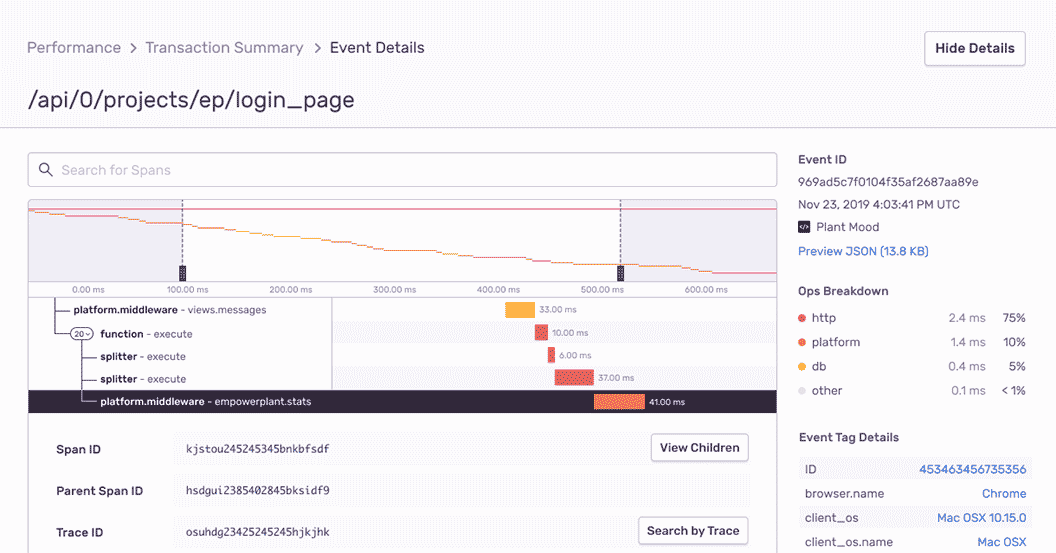
SvelteKit Performance Monitoring

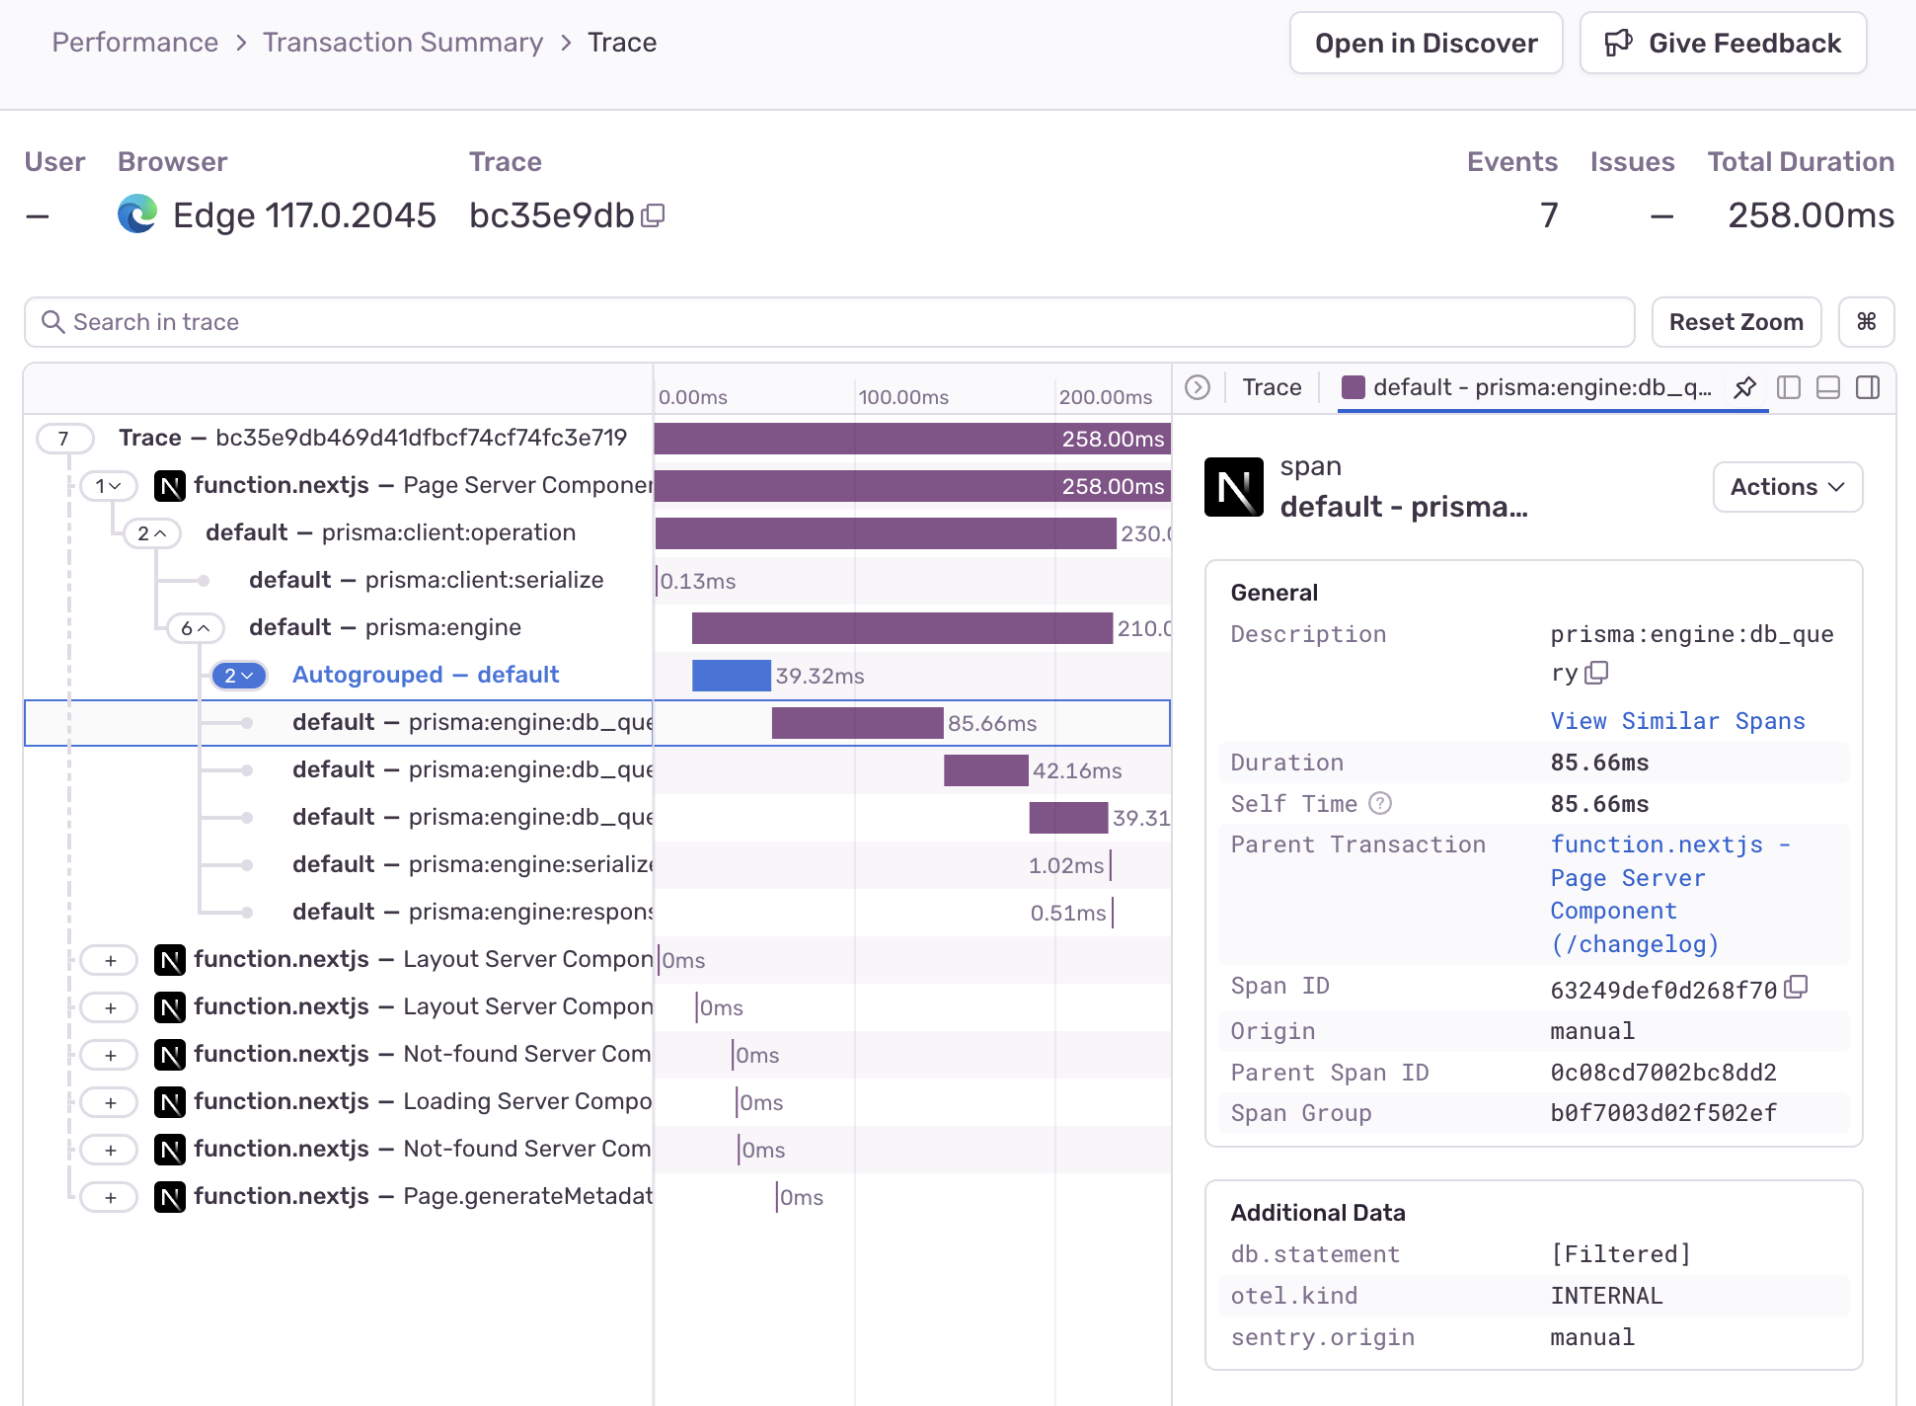
Quickly identify performance issues and view full end-to-end distributed trace to see the exact poor-performing API call and surface any related SvelteKit errors. Improve SvelteKit performance with max efficiency, not max effort.

SvelteKit Error Monitoring With Complete Stack Traces
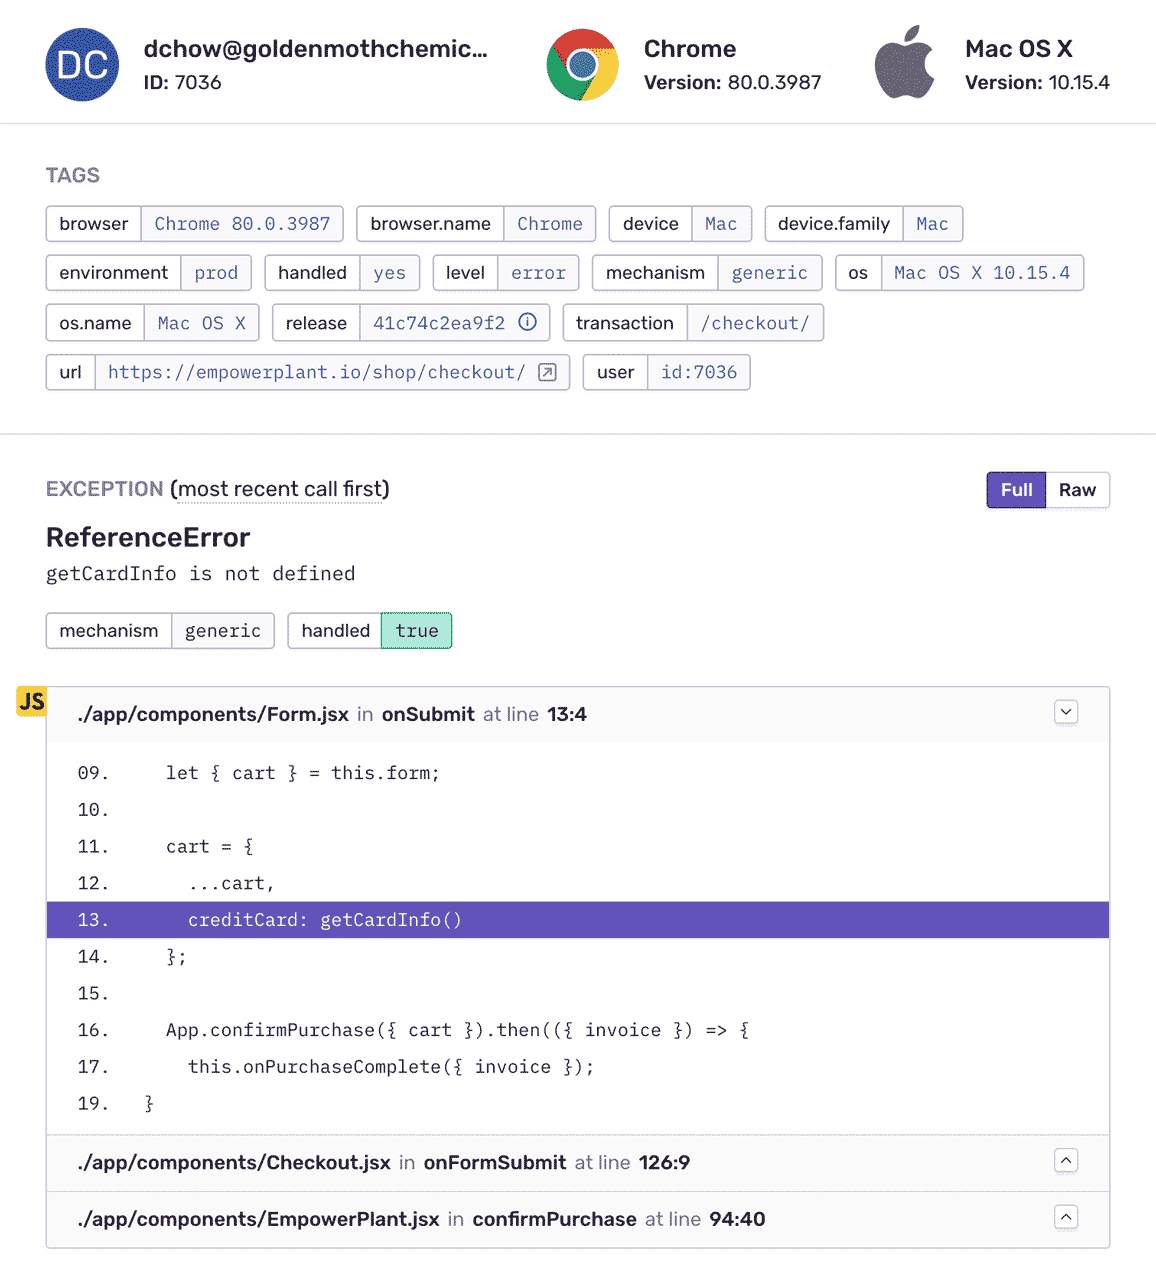
See the error and SvelteKit stack trace previously only visible in your user’s debug console. Apply source maps automatically to convert minified, compiled, or transpiled code back to its original form. Keep your SvelteKit source maps private by uploading them directly to Sentry.

Fill In The Blanks About SvelteKit Errors

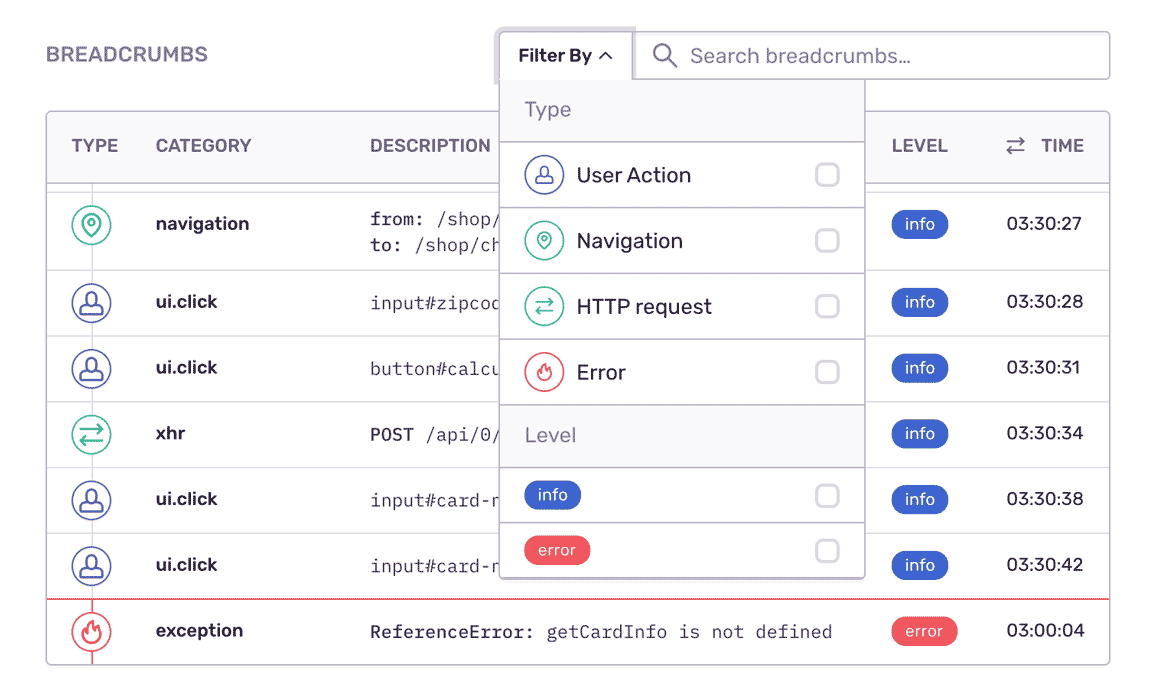
See what the app was doing when the SvelteKit error occurred: user interactions, AJAX requests, console log messages, and more. Learn in which version a bug first appeared, merge duplicates, and know if things regress in a future release

“By correlating Sentry issues to our dev cycle, we can spot where problems begin and how to fix the source.”

Jim Redmond
Sr. System Engineer, Bitbucket

See The Full Picture Of Any SvelteKit Exception

Record environment and usage details so you can recreate bugs down to the browser version, OS, and query parameters specific to your app.

Sentry’s tag distribution graph makes it easy to isolate and prioritize any SvelteKit error by seeing how often it occurs in context.

Find answers to key questions: How actionable is this error? Was the bug browser or OS specific?

You can’t afford to put SvelteKit monitoring on the backburner.

Even a one-second delay in loading results in a 7% reduction in conversions.

Forty percent of customers abandon a website that takes longer than three seconds to load.

The average cost of downtime is $5,600 per minute — or $300,000 per hour.

FAQs

Traditional logging provides you with a trail of events. Some of those events are errors, but many times they’re simply informational. Sentry is fundamentally different because we focus on exceptions, or in other words, we capture application crashes. We discuss in more detail here and on our blog.

Sentry supports every major frontend language, framework, and library. You can browse each of them here.

You can get started for free. Pricing depends on the number of monthly events, transactions, and attachments that you send Sentry. For more details, visit our pricing page.

Sentry doesn’t impact a web site’s performance.

If you look at the configuration options for when you initialize Sentry in your code, you’ll see there’s nothing regarding minimizing its impact on your app’s performance. This is because our team of SDK engineers already developed Sentry with this in mind.

Sentry is a listener/handler for errors that asynchronously sends out the error/event to Sentry.io. This is non-blocking. The error/event only goes out if this is an error.

Global handlers have almost no impact as well, as they are native APIs provided by the browsers.

Supporting Resources

Frontend Monitoring Documentation

Read

A better experience for your users. An easier life for your developers.

© 2023 • Sentry is a registered Trademark
of Functional Software, Inc.