
When writing up external release notes for a launch, many dev teams have to piece together the content by reviewing multiple Jira tickets. Released.so is an AI powered Jira app that summarizes Jira issue content, and publishes it as a release note to the company’s website, Slack or Confluence. By drafting the copy and keeping track of updates since the last release, Released.so can help dev teams write release notes 10X faster.
Their solution requires a lot of coordination between different services. Released.so takes Jira issue details, transforms them into release notes via the OpenAI API, serves the summary in the Released UI and then publishes it to the specified channel. Their tech stack includes a frontend React app and a Node.js project for backend logic such as calling a Postgres database. When the team first set up their infrastructure and separate dev/staging/prod environments, there were a lot of potential failure points.
Wasted time reproducing and fixing errors
Before Sentry, the team would approach debugging errors based on a description of actions the user took and the problem they saw. It was a lot of effort to tease out which things were relevant in the environment. For example, was the network connection spotty for this failure? Was it related to the browser they were using? Knowing this often required multiple iterations of deploying new logs to track down the cause of an error. Released.so needed a more efficient way to know when and why errors happened.
Like most lean startups, they wanted to spend as much time as possible building new features. They wanted an error monitoring tool that didn’t waste cycles on deploying a separate agent VM to push error data or configuring log line filters to catch errors. The tool also couldn’t slow them down by alerting on the same error over and over again. For example, they didn’t want to receive a notification for each HTTP 500 or each error log line.
They needed a tool they could start using fast, could trust to alert them on real errors, and recorded the information needed to debug it. After all, knowing when an error happens isn’t useful if you can’t figure out why it happened.
Faster error debugging
With just a few lines of code, Released.so was able to start using Sentry for error monitoring. Released.so Co-founder, Adam Ahmed noted, “Sentry’s auto-instrumentation is so good, one call to init() will track your whole stack: HTTP requests, database queries, and everything in between.”
The team currently has alerts set up for all new issues, but is able to keep their issue stream actionable (aka not noisy) by regularly assigning issues and using Archive Until Escalating. With a single click, the Archive feature removes an issue from the main issue stream until frequency increases. This has been especially helpful as related to calling the OpenAI API. Adam said, “We expect the OpenAI service to send us a couple 500 errors when under load, which we can retry and usually the user doesn’t see the problem at all, but if it starts sending back a lot of them, we need to take a closer look.”
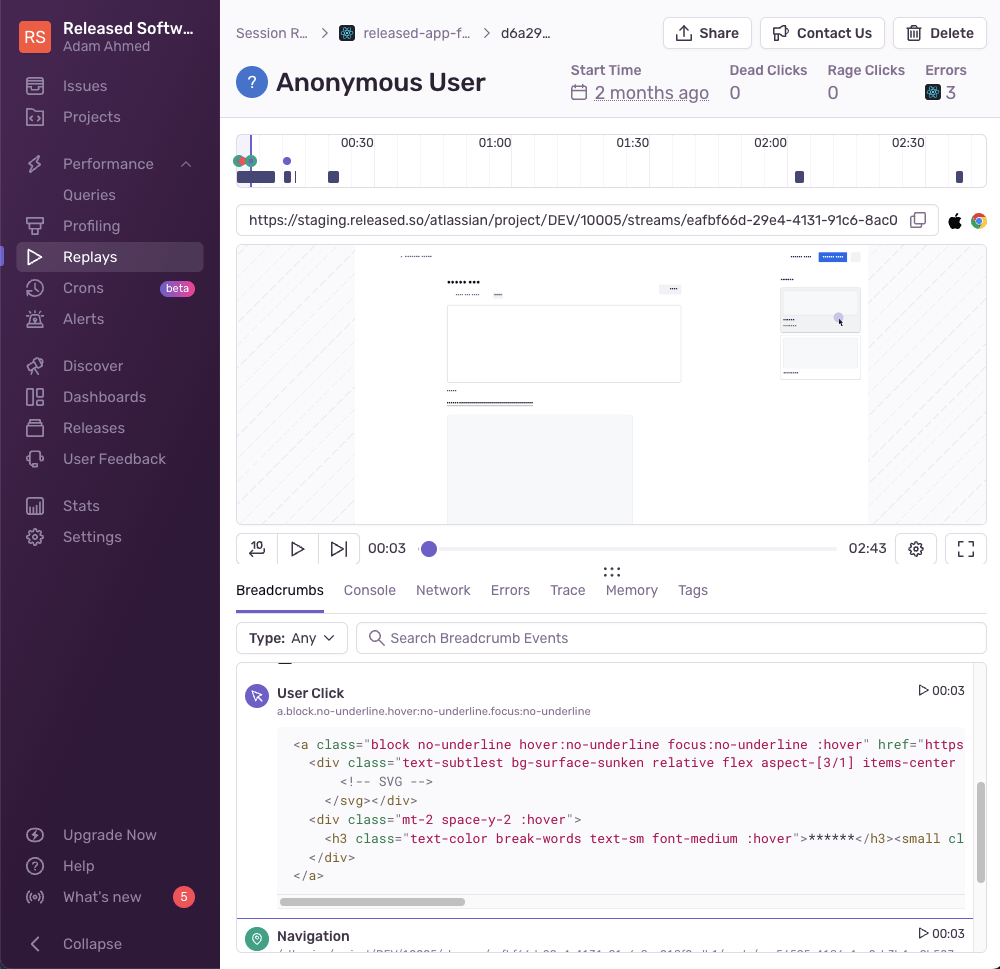
With the context of the stack trace, the team no longer relies on error logs to understand the lines of code executed prior to an error. And after turning on Session Replay, they have a complete step-by-step understanding of the actions the user and their app took when an error occurred.
“For particularly hairy errors, it’s great that Sentry’s
captureExceptionmethod acceptsextrasfor us to log relevant custom information. For example we can track metadata about the particular request and response when a third-party system fails.”Adam Ahmed, Released.so Co-founder
Adam also notes that the team has found custom tagging especially useful. Recently they ran into a Jira bug that occurred under a seemingly random set of circumstances that rendered the issue data in Jira invalid. With custom tagging, they were able to sort and track metadata about the issue to sample events where the problem occurred.
More than error monitoring
As Released.so grew, improving the performance of their application became a higher priority. With Sentry Performance the team has caught a number of performance regressions across their stack.
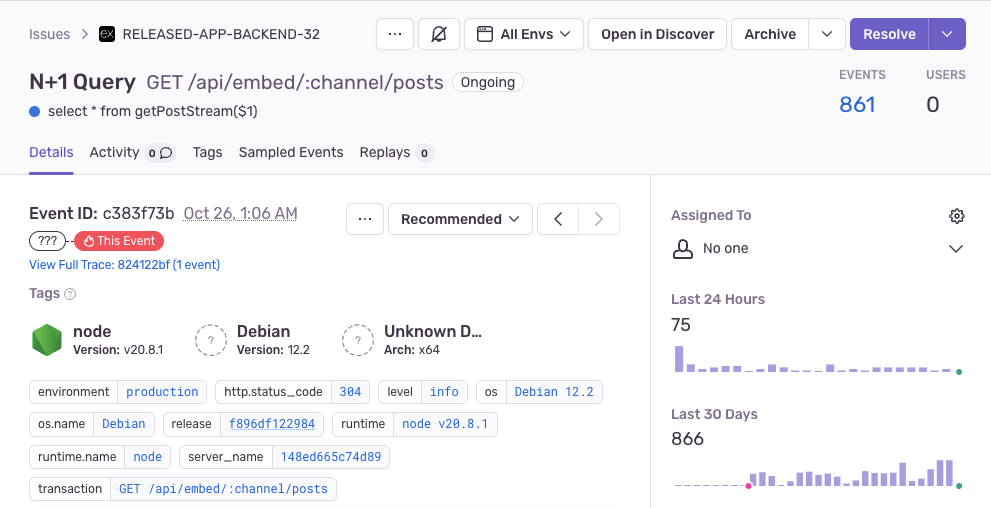
Recently Sentry uncovered an N+1 Query Performance Issue in their Node.js project that they weren’t aware of. Adam said, “In our case, we were checking permissions on the container of this item, when they all have the same container. Sentry noticed this before we did and it was an easy fix to reduce chatter in our app.”
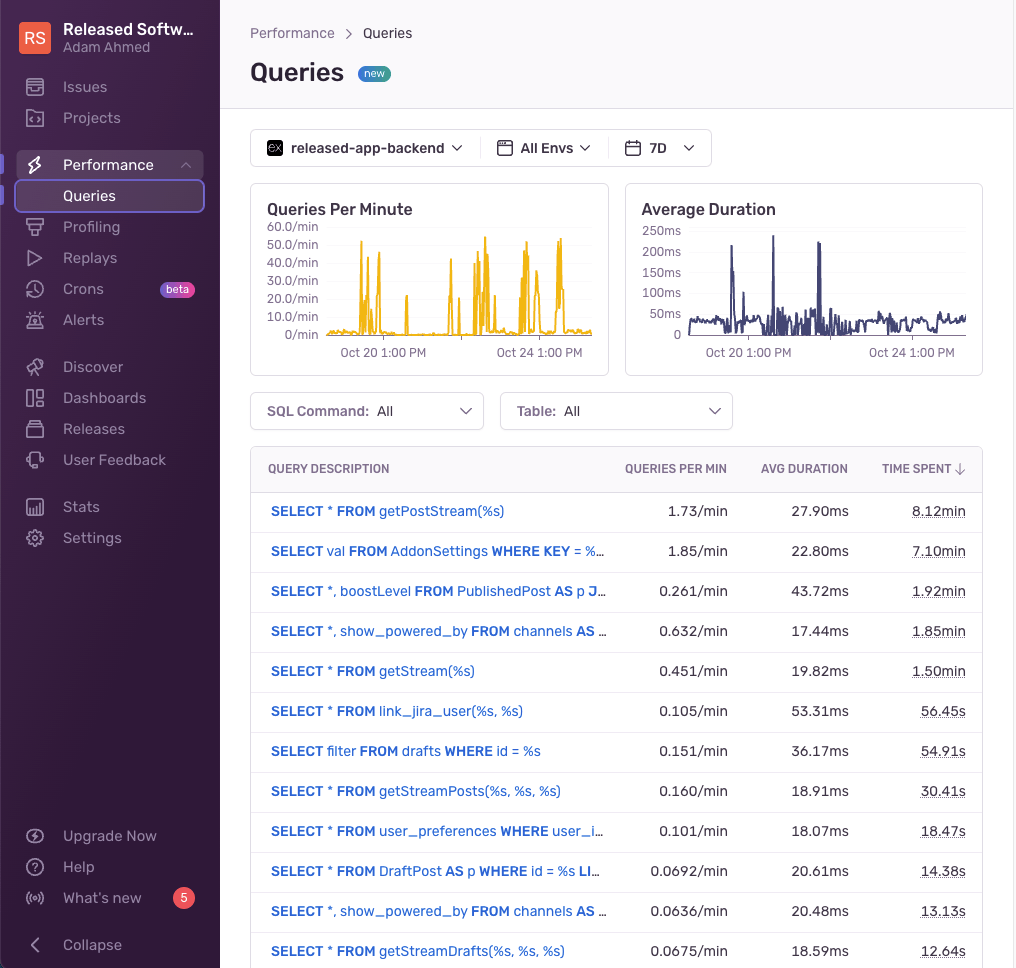
Adam and team have also been using the Queries tab to track the performance of their database queries. “I like the “Time spent” field which shows total time spent by a particular function. A function can be slow, but it matters a lot more if the function is called often. The Time Spent field is a good proxy for the effect a slow function is really having on the system’s load.”
What’s next
The Released.so team is currently working on further improving error context by adding more custom tags, and setting up Profiling for their React project. To better organize Sentry alerts, they also plan to integrate Opsgenie.
“Sentry has dramatically reduced our time to resolution - in some cases from weeks to minutes. In most cases, our team typically saves 2-3 hours of back-and-forth with customers and debugging time for each error.”
Adam Ahmed, Released.so Co-founder