Django Error Monitoring

Actionable insights to resolve Django performance bottlenecks and errors. Improve your monitoring workflow with a full view of releases so you can mark Django errors as resolved and prioritize live issues.

Getting Started is Simple

Install our Python SDK using pip:

pip install --upgrade sentry-sdk

Initialize the Python SDK with the Django integration in your settings.py file.

import sentry_sdk from sentry_sdk.integrations.django import DjangoIntegration sentry_sdk.init( dsn="https://<key>@sentry.io/<project>", integrations=[DjangoIntegration()], # Set traces_sample_rate to 1.0 to capture 100% # of transactions for performance monitoring. # We recommend adjusting this value in production, traces_sample_rate=1.0, # If you wish to associate users to errors (assuming you are using # django.contrib.auth) you may enable sending PII data. send_default_pii=True )

Check our documentation for the latest instructions.

See all platforms

More than 90K Organizations Trust Sentry with Their Application Monitoring

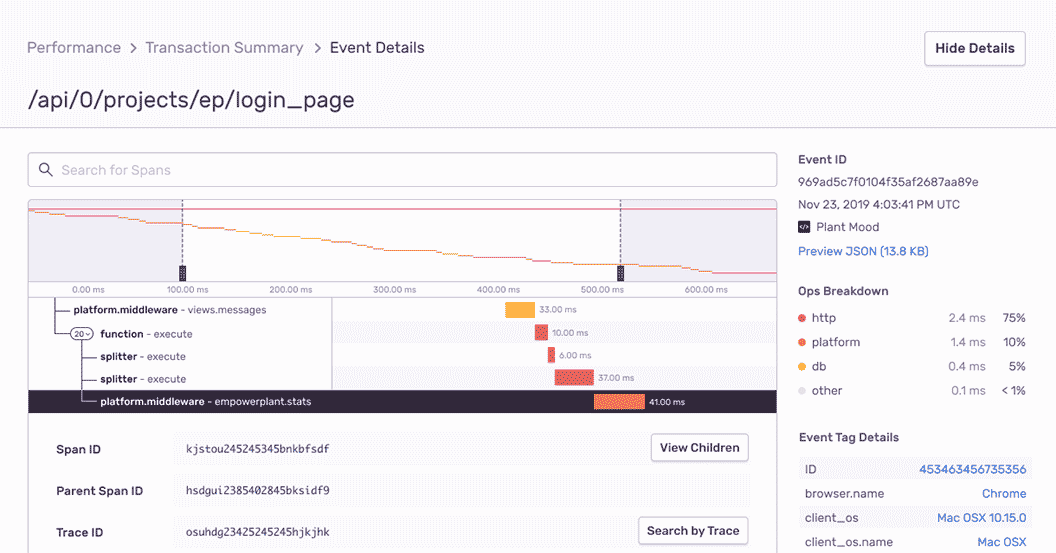
Django Performance Monitoring

Within minutes after installing Sentry, software teams are able to trace Django performance issues back to a poor performing API call as well as surface all related code errors. Engineering Managers and Developers now have a single tool to optimize performance of their code and deliver fast customer experiences with Performance Monitoring.

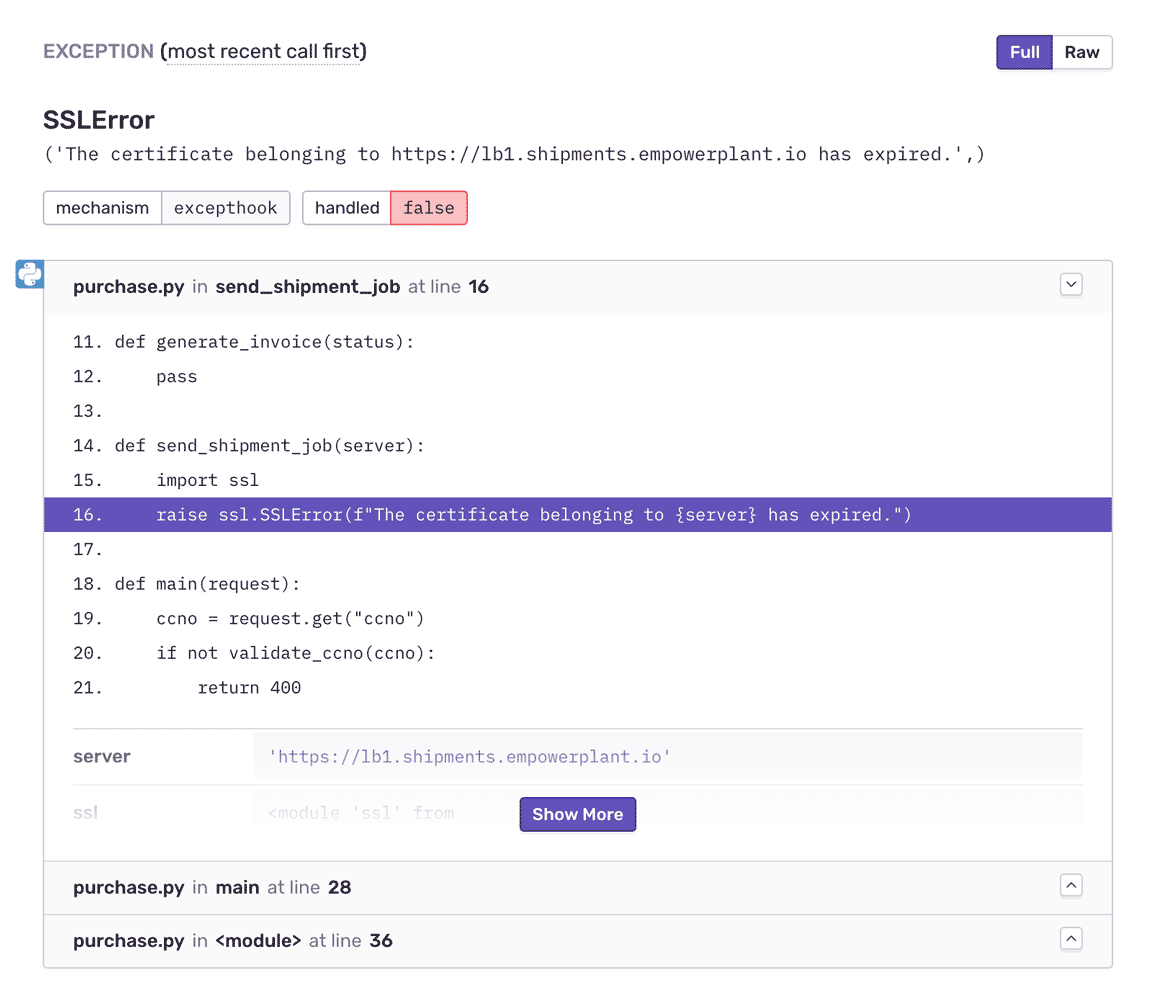
Django Error Monitoring with Complete Stack Traces

See local variables in the stack for prod errors, just like in your dev environment. Introspect more deeply into the runtime and jump into the frame to get additional data for any local variable. Filter and group Django exceptions intuitively to eliminate noise.

Fill In the Blanks About Django Errors

Expose the important events that led to each Django exception: SQL queries, debug logs, network requests, past errors. Learn in which version a bug first appeared, merge duplicates, and know if things regress in a future release.

Sentry helps our team fix the most important issues in each release.”

Jaylum Chen
Staff Software Engineer, Eventbrite

See the Full Picture of Any Django Exception

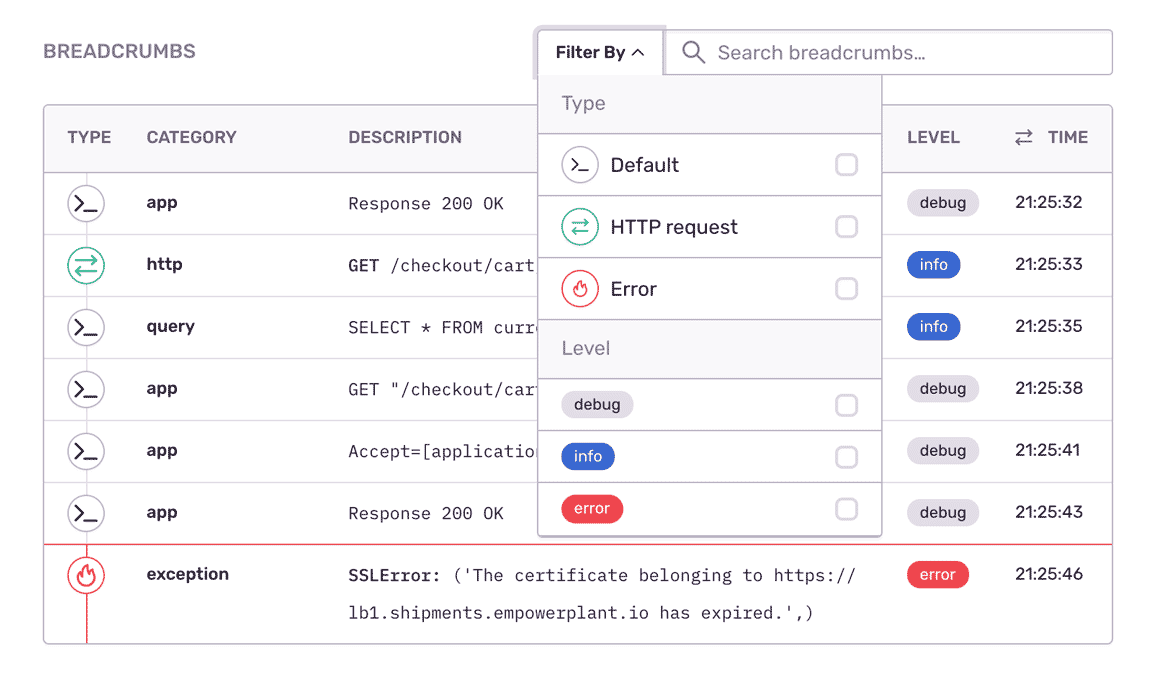
Aggregate errors by details like HTTP request, hostname, and app version to see what’s new, a priority, or a trend.

Assign custom tags to reproduce the error environment specific to your application, business, and users.

Find answers to key questions: How actionable is this error? In which app release did the Django bug occur?

FAQs

Traditional logging provides you with a trail of events. Some of those events are errors, but many times they’re simply informational. Sentry is fundamentally different because we focus on exceptions, or in other words, we capture application crashes. We discuss in more detail here and on our blog.

Sentry supports every major language, framework, and library. You can browse each of them here.

You can get started for free. Pricing depends on the number of monthly events, transactions, and attachments that you send Sentry. For more details, visit our pricing page.

Sentry doesn’t impact a web site’s performance.

If you look at the configuration options for when you initialize Sentry in your code, you’ll see there’s nothing regarding minimizing its impact on your app’s performance. This is because our team of SDK engineers already developed Sentry with this in mind.

Sentry is a listener/handler for errors that asynchronously sends out the error/event to Sentry.io. This is non-blocking. The error/event only goes out if this is an error.

Global handlers have almost no impact as well, as they are native APIs provided by the browsers.

Supporting Resources

How Slow is Slow?

Resolve Django errors with max efficiency, not max effort

© 2024 • Sentry is a registered Trademark
of Functional Software, Inc.