
Native Application Error
Monitoring With Sentry
Your applications run on end devices that provide little (if any) feedback when something goes wrong. Debug native applications faster with the power of alerts, context, and root-cause analysis.
Works with
How it works
With error and crash capturing, context and tag setting, and breadcrumb recording, exception handling just got easier.
- Select the right SDK for your language or frameworks.
- Spend a few minutes setting it up.
That's it! Check out the Sentry Native SDK documentation for more information.
Better Crash Report Analysis,
More Efficient Workflows
With increased support for native crash reporting, developer teams have access to better crash report analysis, which contributes to more efficient workflows and deeper visibility into application health.
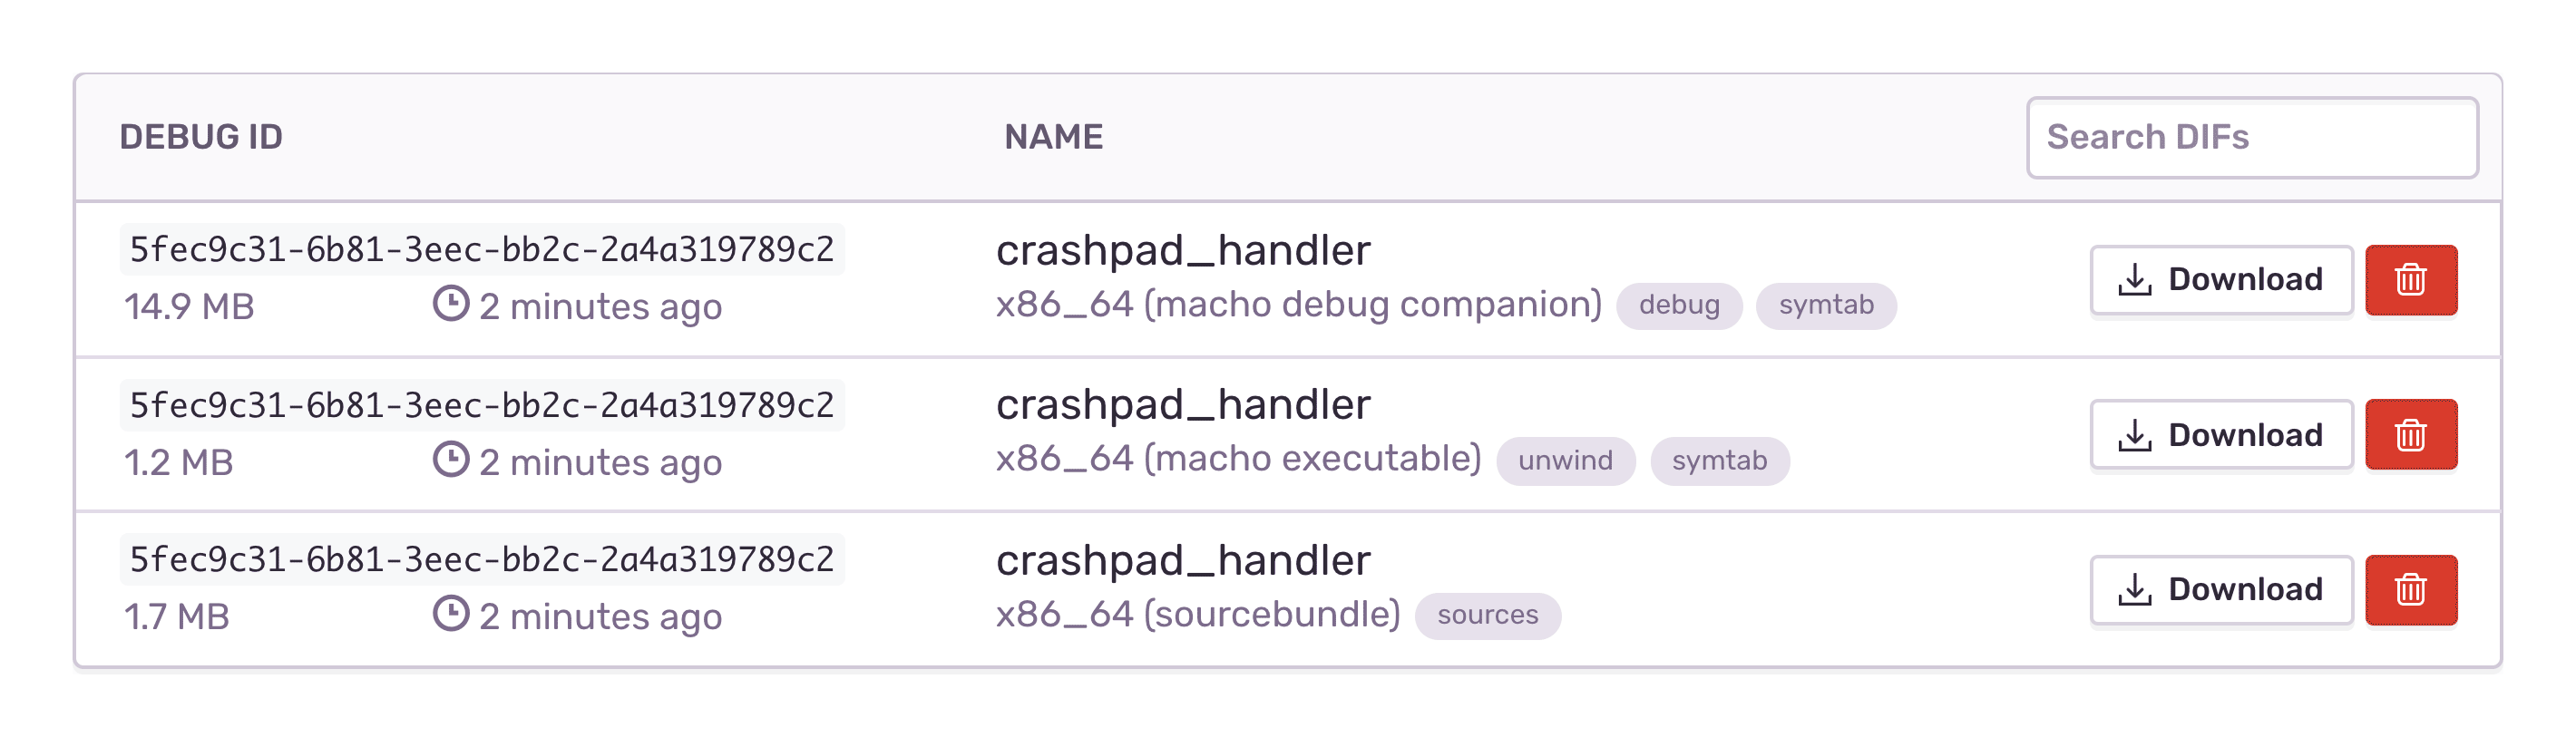
Debug Files Support
Stop converting Breakpad symbols for debug files. Sentry deals directly with Microsoft PDBs, Apple dSYMs, and Linux DWARF files, providing full access to Inline Frames and reducing the barriers to uncover an error's root cause.

Symbol Servers
Sentry pulls debug files from external sources on demand, like an S3 bucket or the Microsoft Symbol Server. Use the time saved by not uploading debug files ahead of time for something you enjoy -- like shipping clean code.
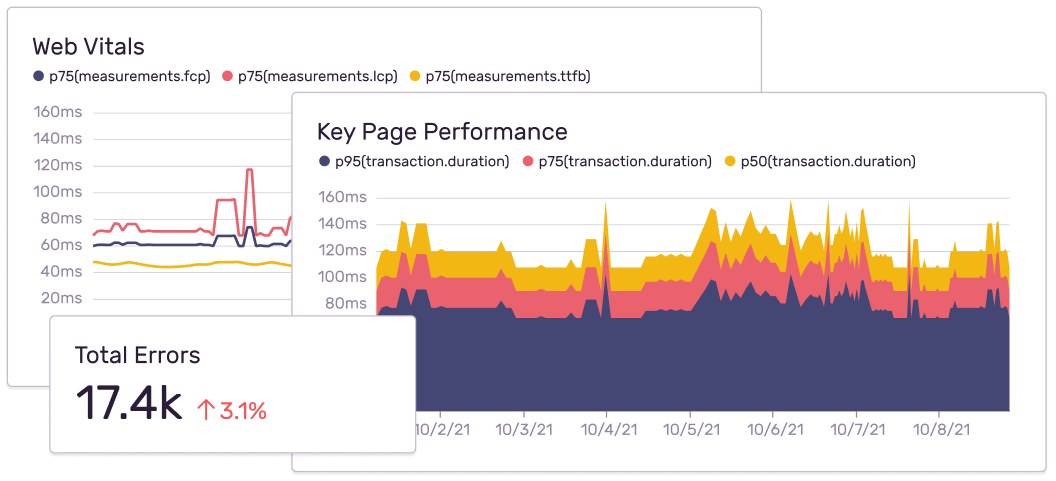
Monitor Release Health
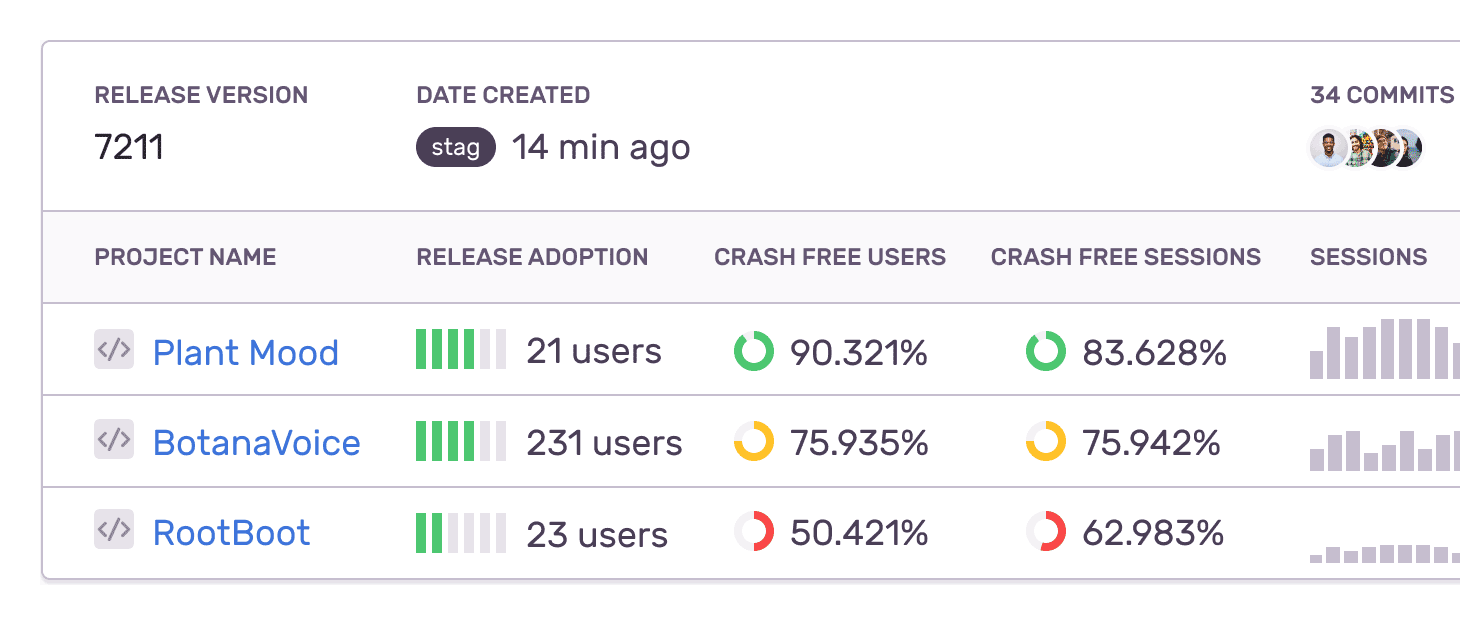
Closely track user adoption, usage of the application, percentage of crash-free users and sessions. Sentry for Mobile provides insight into the impact of crashes and bugs as it relates to user experience and application versions.
Measure the health of mobile releases over time and view trends with each new issue through the release details, graphs, and filters.
Context When And Where You Need It
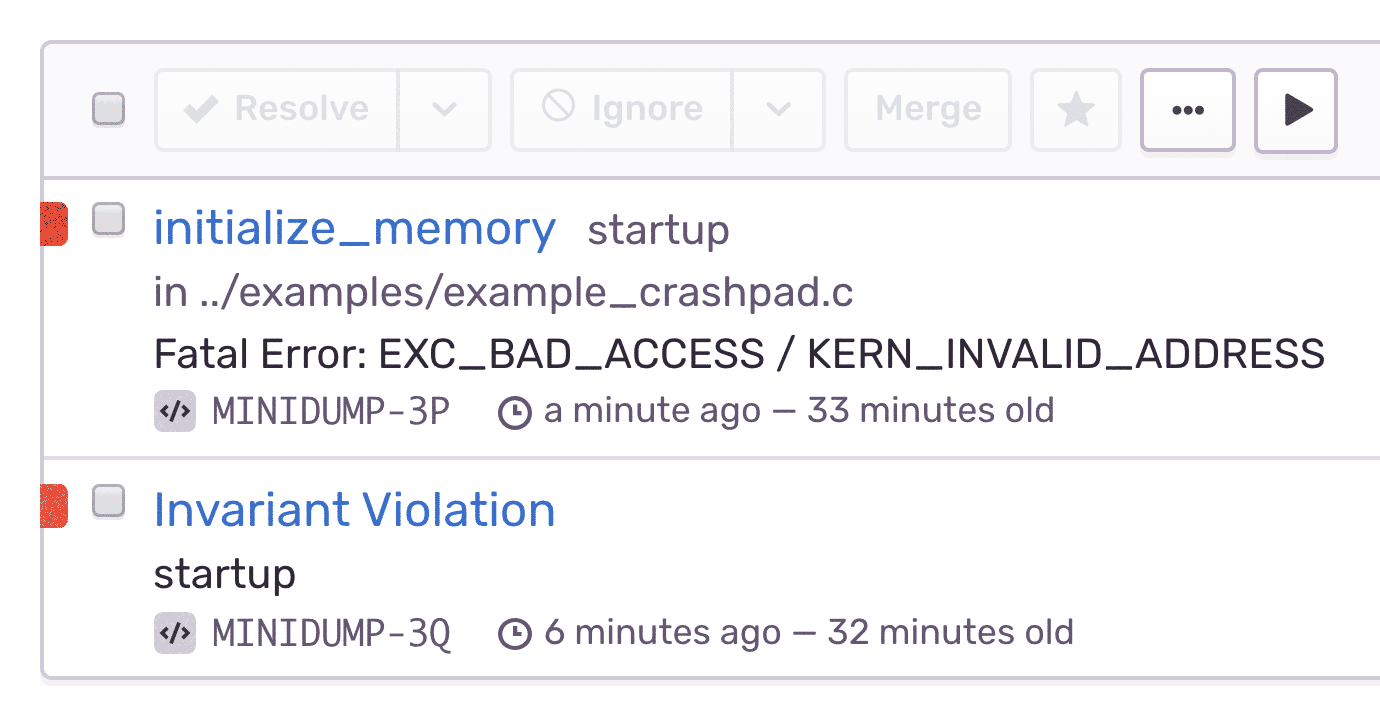
Grouping
Sentry groups Events into Issues. We have maintained (and continuously improved) default rules, but you're also welcome to configure your own. After all, you know your Events best.
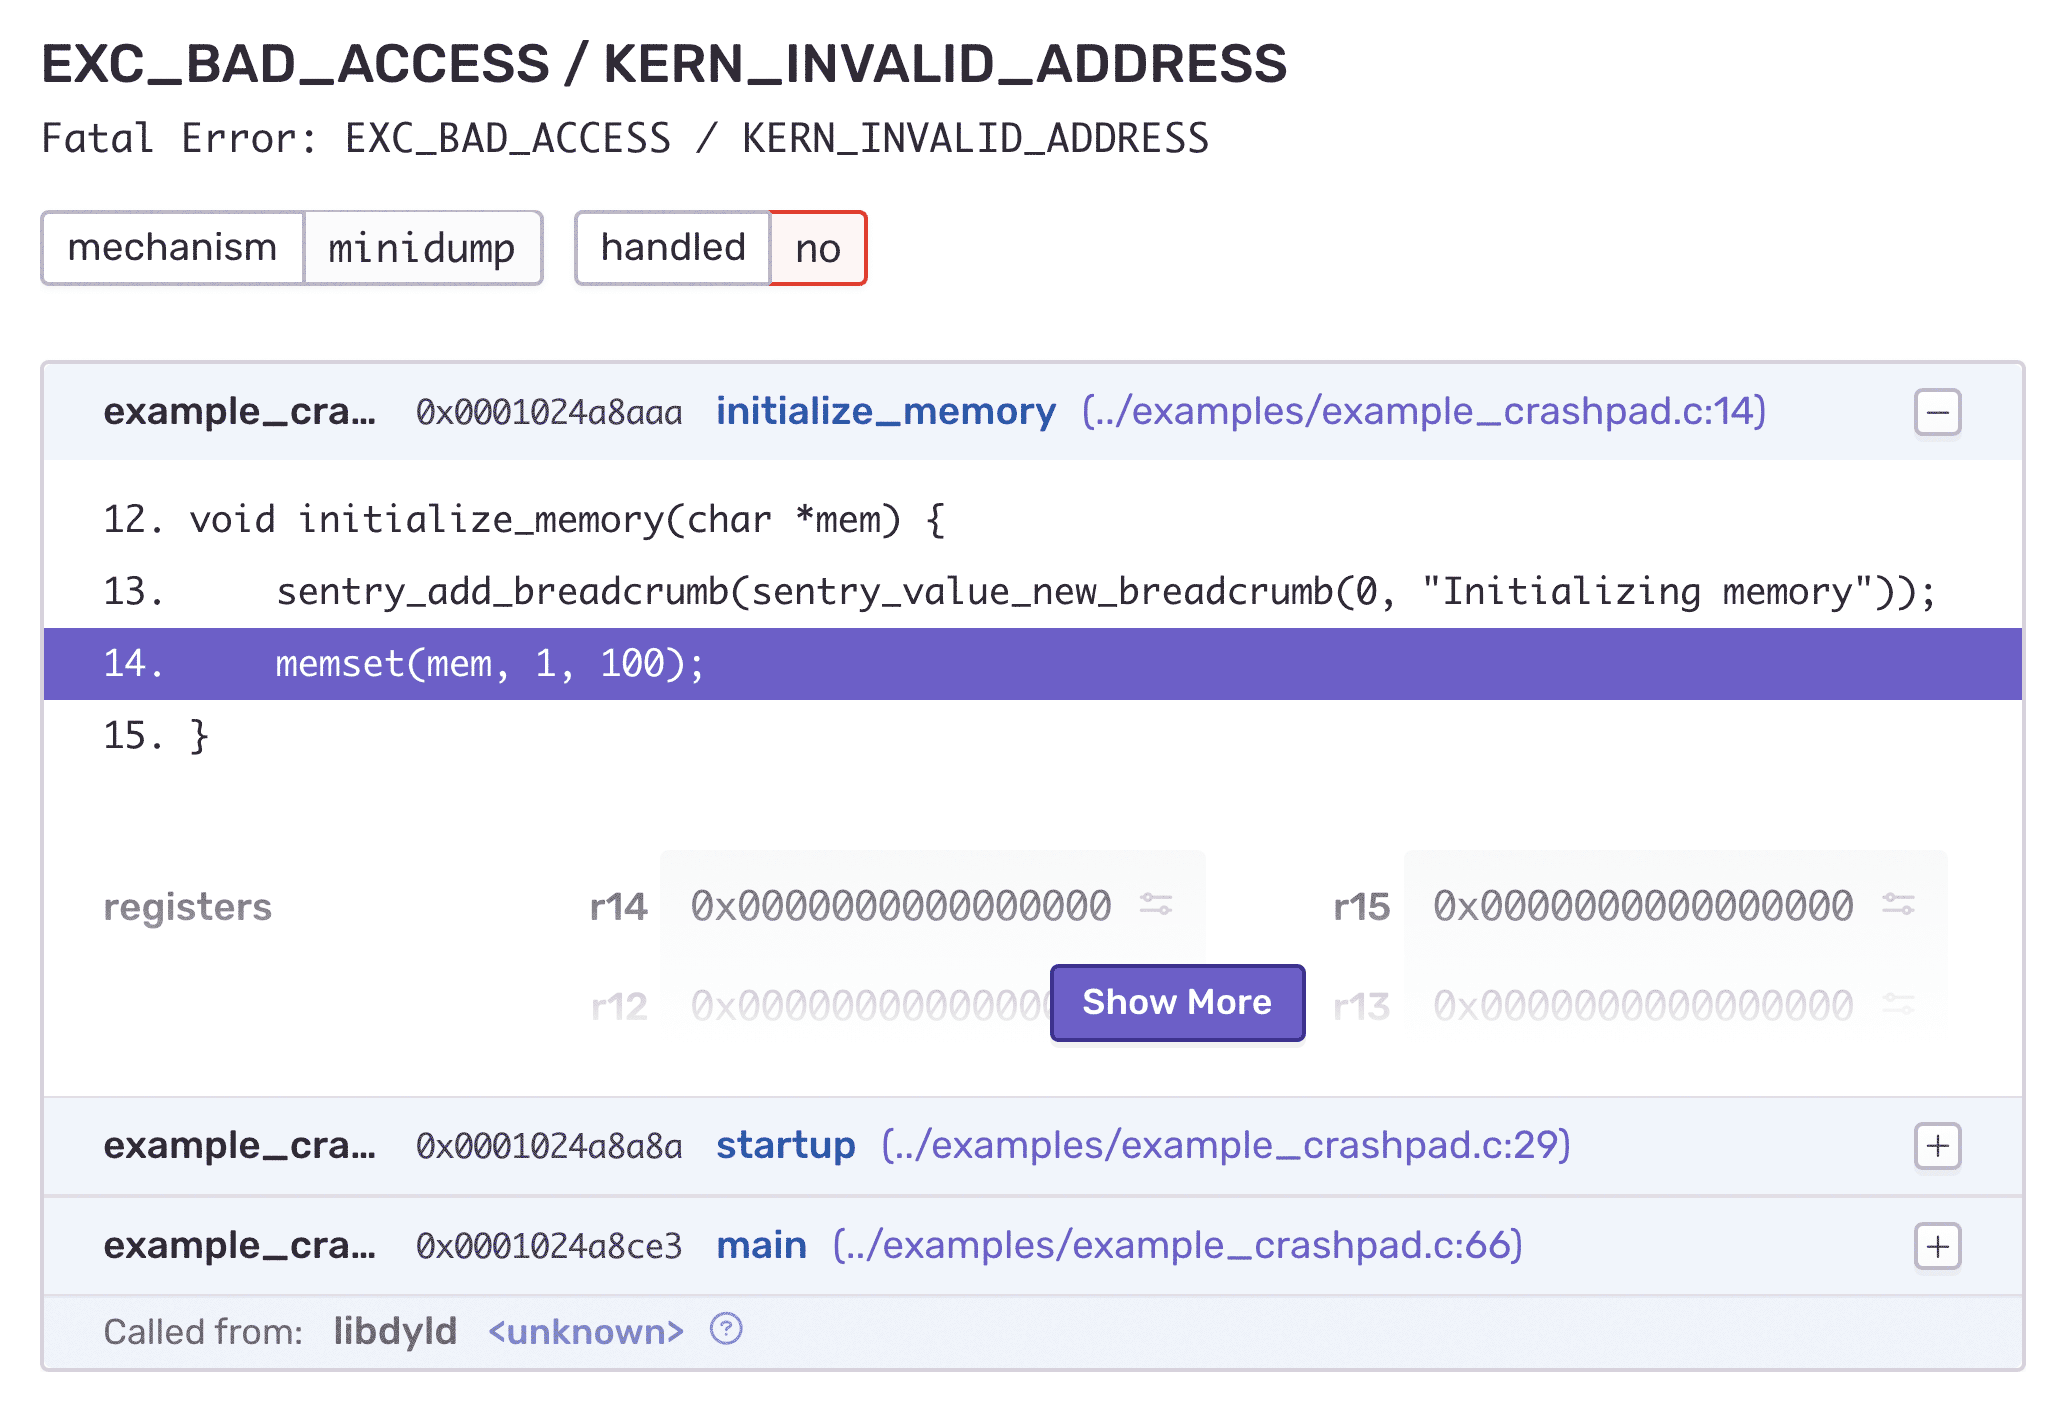
Symbolication
Error reports contain a fully symbolicated backtrace displayed in the context of the source code where the error happened.
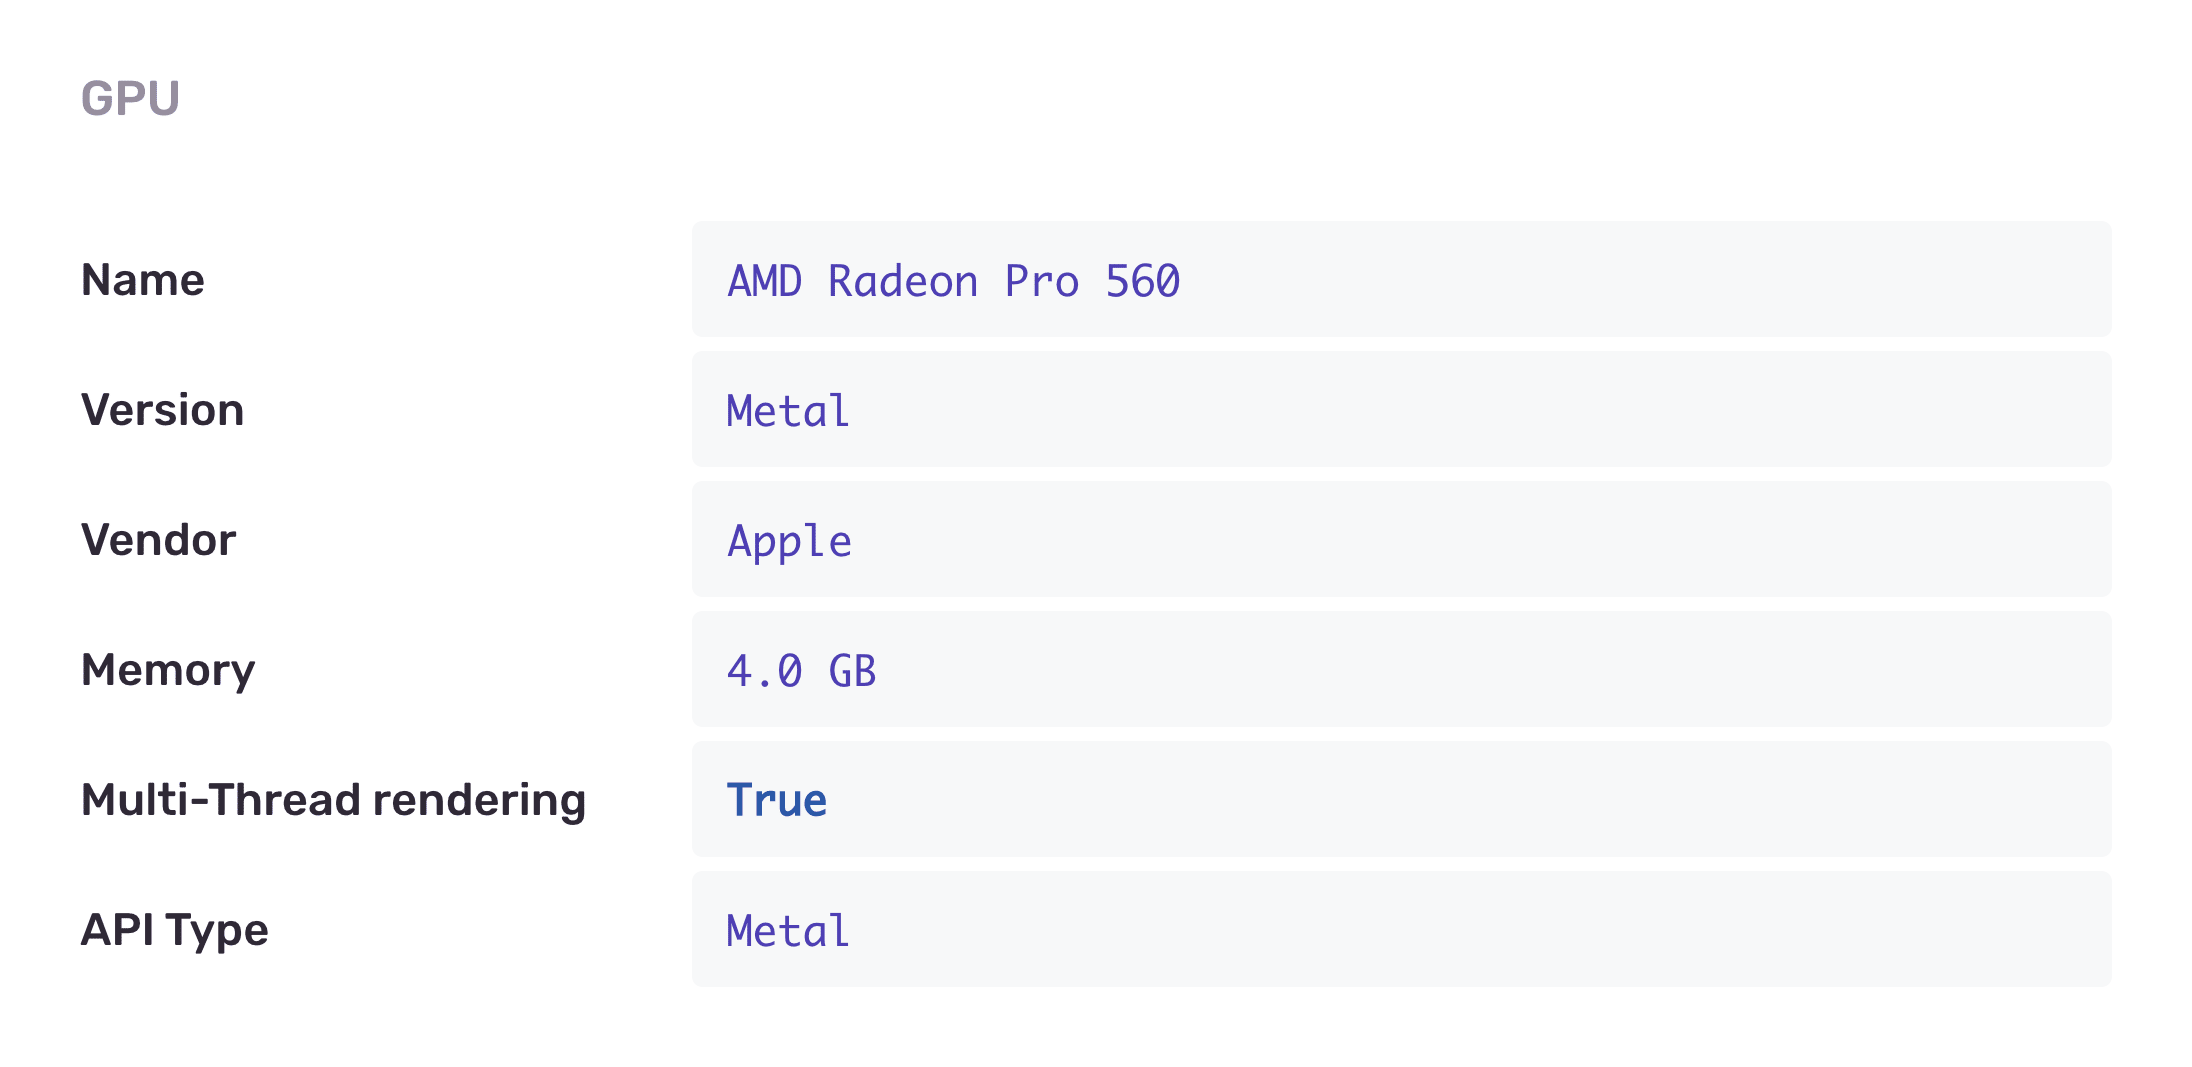
API-Enriched Context
Deep context allows insights into user identification, settings, hardware configuration, and more. With the addition of log and configuration files, developer teams can triage and uncover the root cause of an error faster, with less impact.
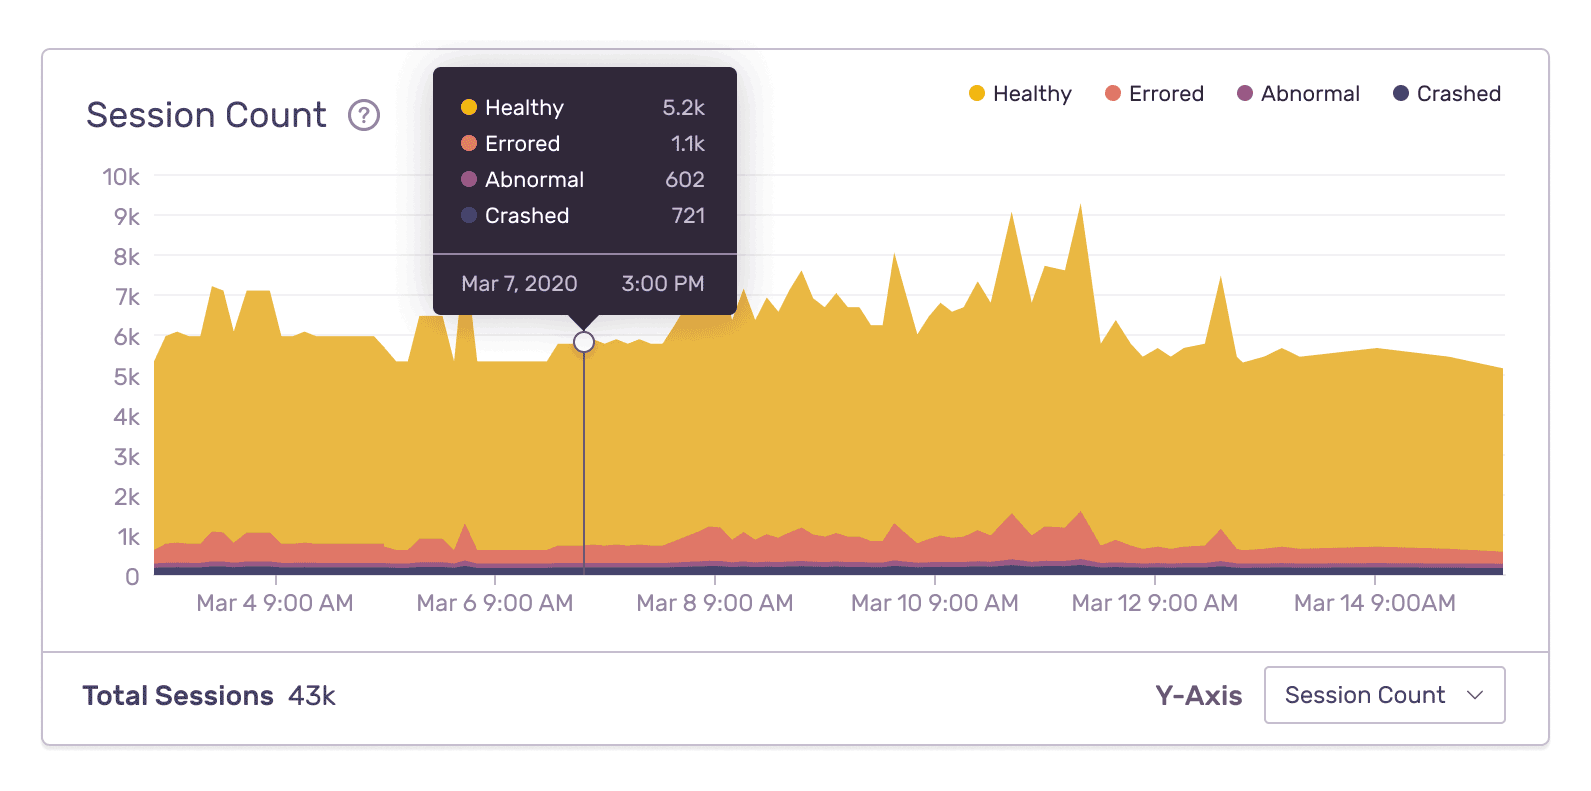
Understand The Impact
Are your highest-paying customers affected? Receive detailed analysis of error distributions and timelines, for instance, by GPU vendor or the geographical location.
Reduce The Cost Of Maintenance
The cost of maintaining in-house error monitoring is steep. Sentry improves the rate of functionality delivered and allows you to refocus those full-time resources.
Is your data secure? You better believe it.
Just look at all the high-quality security features all accounts get, regardless of plan.
- Two-Factor Auth
- Single Sign-On support
- Organization audit log
- SOC 2 Type II and ISO 27001 certified
- HIPAA attestation
- PII data scrubbing
- SSL encryption
- Data Processing Addendum (includes latest EU SCCs)
- Privacy Shield certified
All Errors, One Place
Use Sentry to collect and process errors from clients and
connected projects. We support all major platforms.


