Datadog + Sentry Integration
Correlate errors from Sentry with metrics in your Datadog dashboards.
See the docs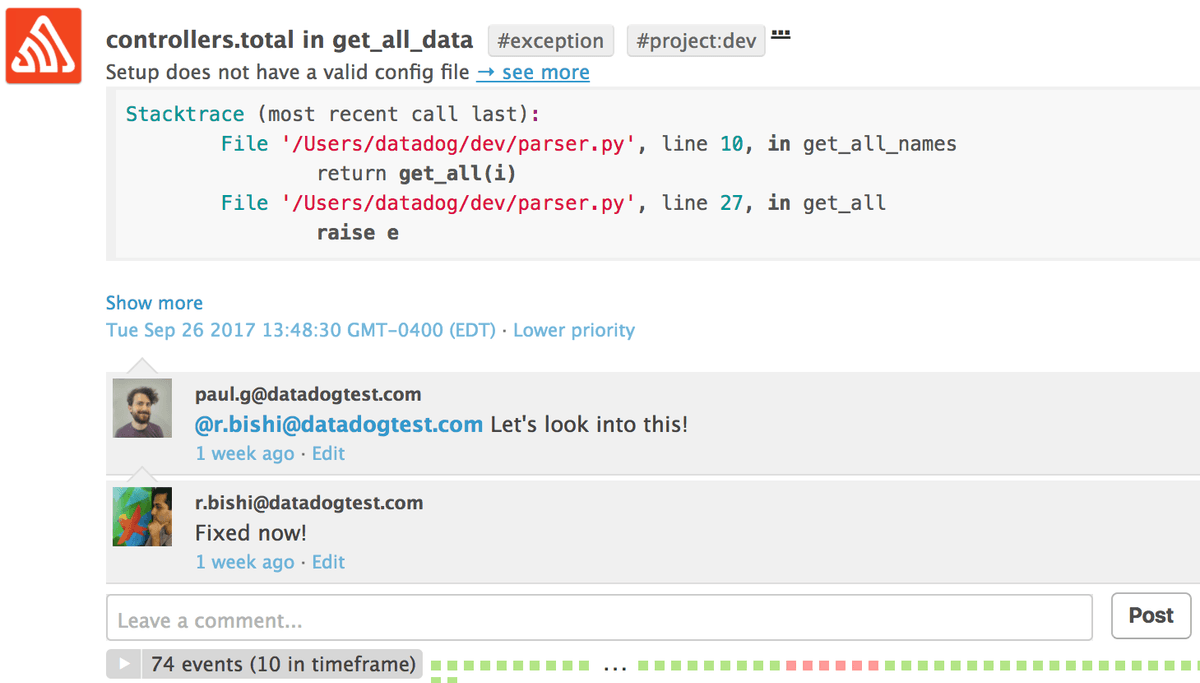
Events and metrics in one dashboard
Quickly discover relationships between production apps and systems performance. Seeing correlations between Sentry events and metrics from infra services like AWS, Elasticsearch, Docker, and Kafka can save time detecting sources of future spikes.
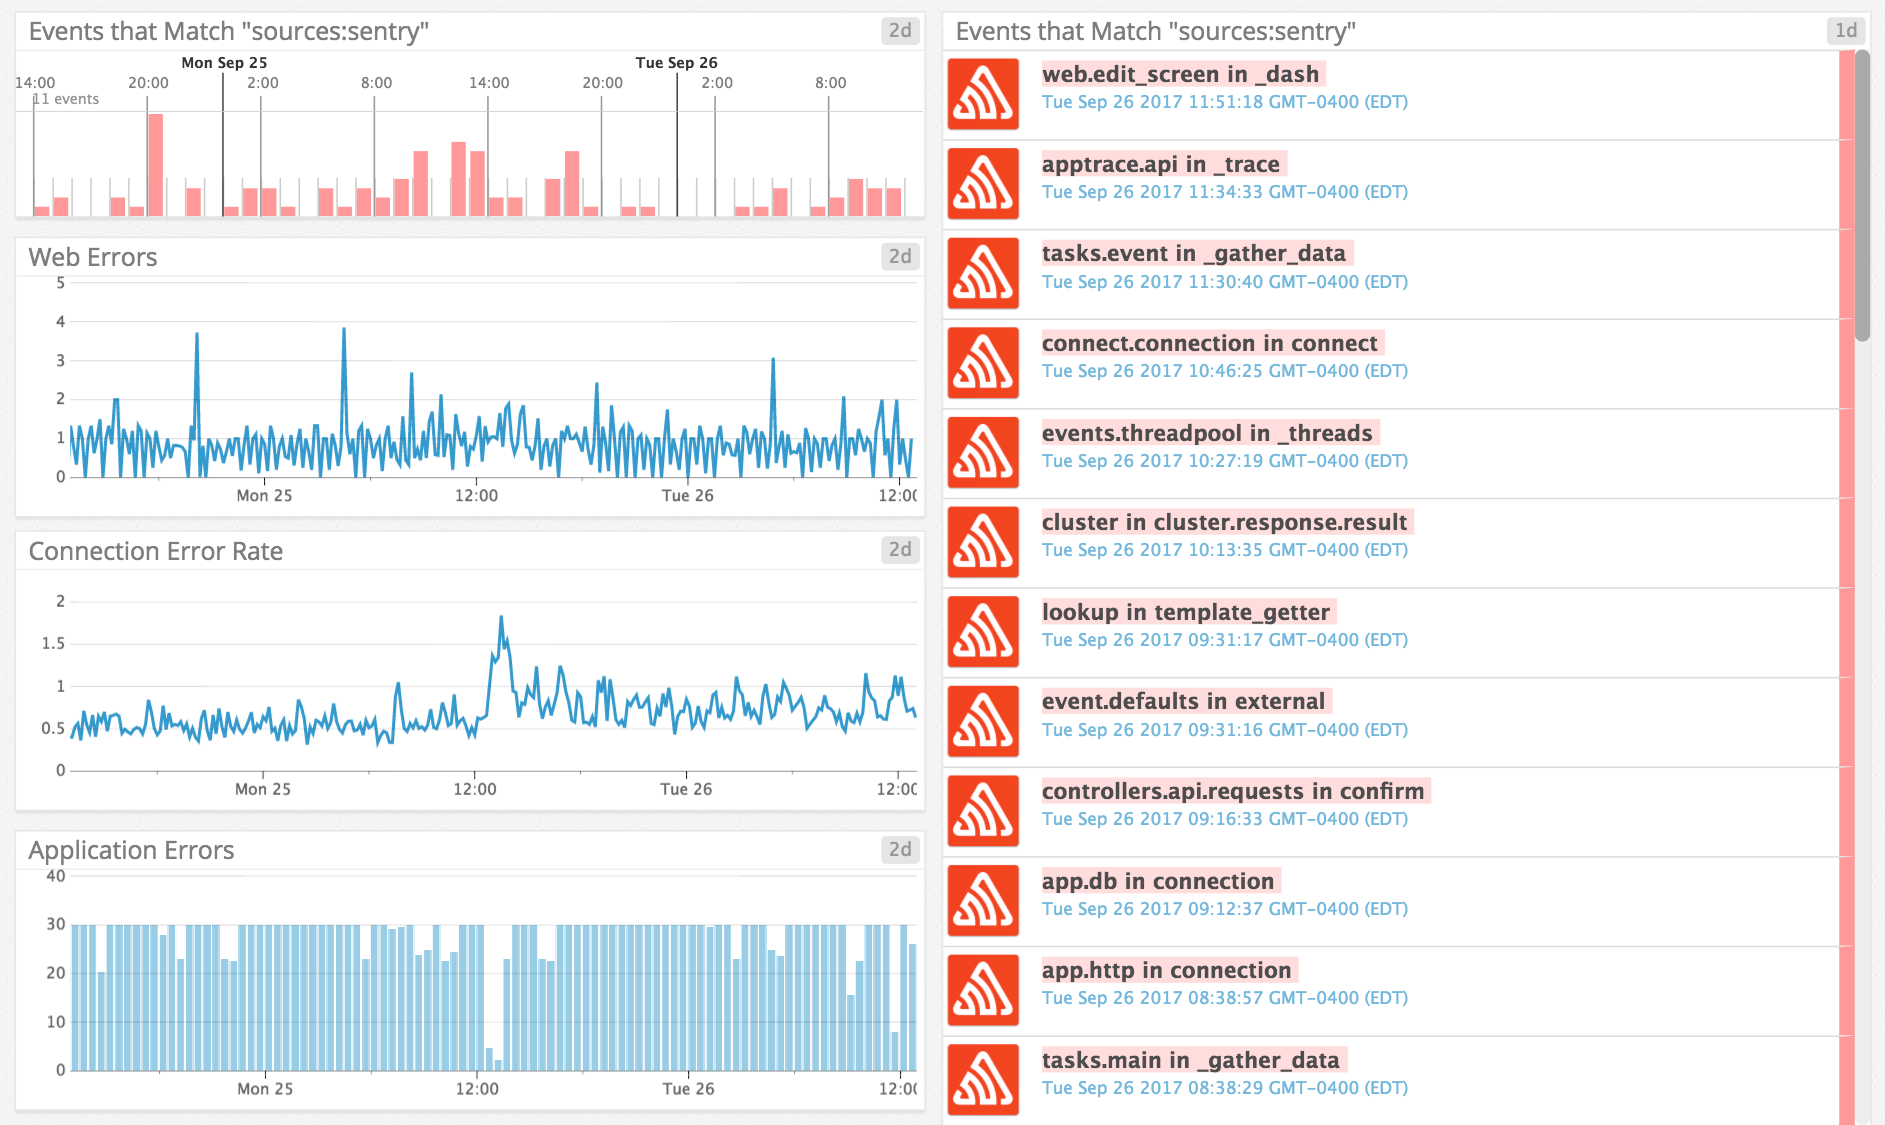
Synthetic error dashboards
Build custom visualizations showing off any events you choose from Sentry using the query sources:sentry to create a new Datadog dashboard and plot error trends over time.
Read the config guide to get started.
Is your data secure? You better believe it.
Just look at all the high-quality security features all accounts get, regardless of plan.
- Two-Factor Auth
- Single Sign-On support
- Organization audit log
- SOC 2 Type II and ISO 27001 certified
- HIPAA attestation
- PII data scrubbing
- SSL encryption
- Data Processing Addendum (includes latest EU SCCs)
- Privacy Shield certified
All errors, one place
Use Sentry to collect and process errors from clients and connected projects. We support all major platforms.


